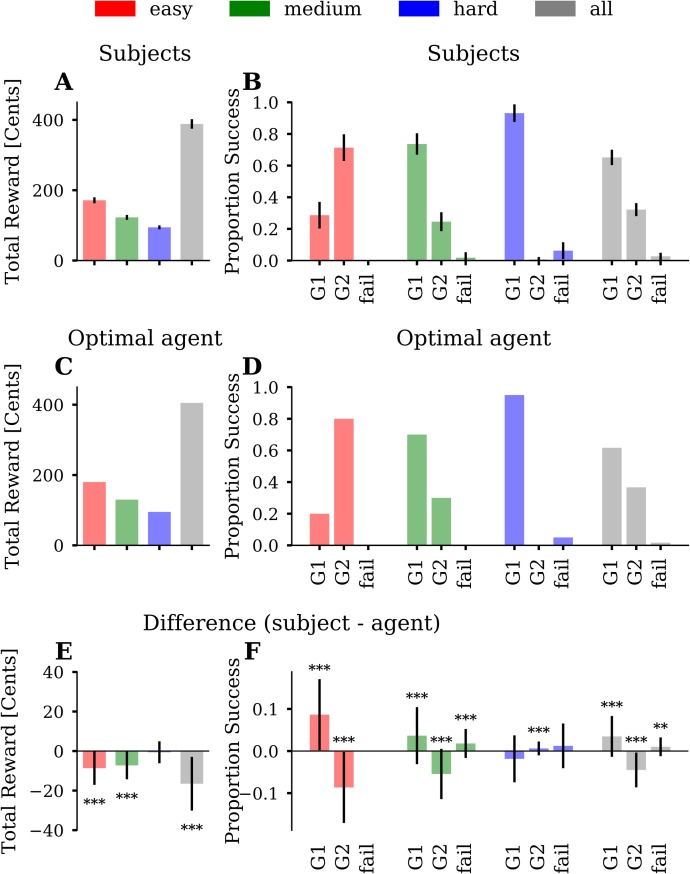
Fig 3. Standard analyses of total reward and comparison to the optimal agent.
(A) Average total reward across participants. The three conditions are colour-coded (easy = red, medium = green, blue = hard) and the average over conditions is shown in grey. Error bars depict the standard deviation (SD). (B) Proportion of successful goal-reaching averaged across participants, for each of the three conditions. We plot the proportion of reaching, at the end of a miniblock, a single goal (G1), both goals (G2), or no goal (fail). The fourth block of bars in grey represents the proportions averaged over all three conditions. Error bars depict SD. (C) Simulated total reward of the optimal agent. (D) The goal-reaching proportions of the optimal agent. (E) Average difference between participants and agent with error bars depicting SD. (F) Averaged difference of proportion success between participants and agent with error bars depicting SD. One can see that the average goal-reaching proportions of participants were close to the agent’s proportions. However, participants, on average, reached G2 less often than the agent. Asterisks indicate differences significantly greater than zero (Sign-test, * ≙ p < 0.05, ** ≙ p < 0.01, *** ≙ p < 0.001).

