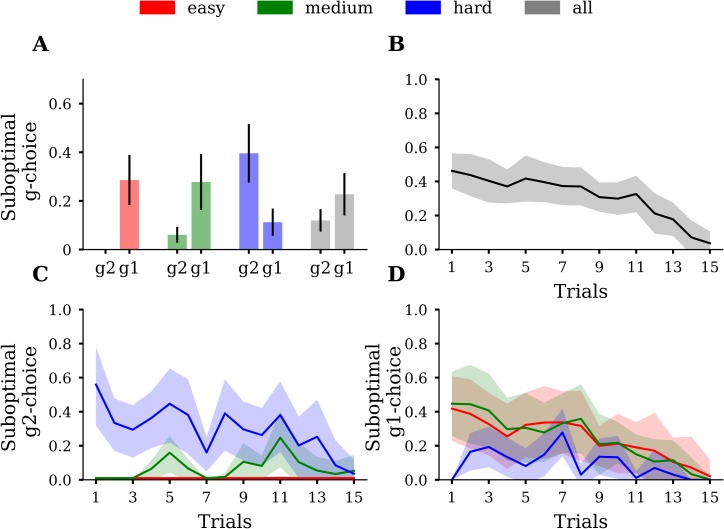
Fig 4.
(A) Proportions of suboptimal g1-choices (g1) and suboptimal g2-choices (g2), averaged over participants. Participants tend to make suboptimal g1-choices in the easy and medium condition while this pattern reverses in the hard condition. Error bars depict SD. Conditions are colour coded. (B) Suboptimal g-choices as a function of trial averaged over participants. Shaded areas depict SD. (C) Suboptimal g2-choices as a function of trial averaged over participants. (D) Suboptimal g1-choices as a function of trial averaged over participants. In both C and D, one can see that participants made more suboptimal g-choices at the beginning of the miniblock than close to the final trial. Shaded areas depict SD.

