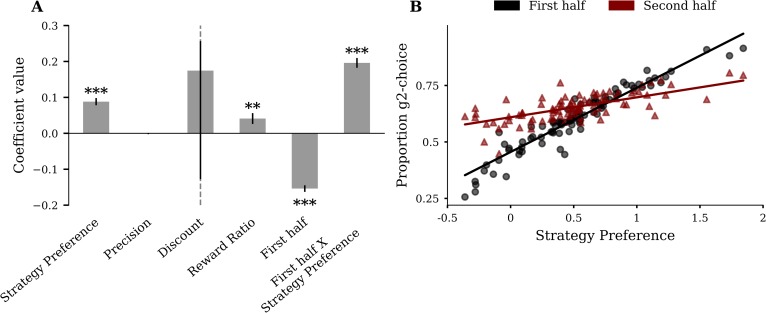
Fig 6. Strategy preference is more predictive for participant’s proportion of g2-choices in the first than in the second half of the miniblock.
(A) Linear regression of proportion g2-choice against parameters from the four-parameter model, a dummy variable coding for miniblock-half and interaction between miniblock-half and strategy preference. The significant interaction term supports the hypothesis that the influence of strategy preference on g2-choice proportion is greater in the first than in the second half of the miniblock. Error bars represent SE. Asterisks indicate coefficients significantly different from 0 (t-test, * ≙ p < 0.05, ** ≙ p < 0.01, *** ≙ p < 0.001). (B) Strategy preference plotted against the proportion of g2-choices in the first half of the miniblock (black) and in the second half of the miniblock (red). Solid lines represent marginal regression lines.

