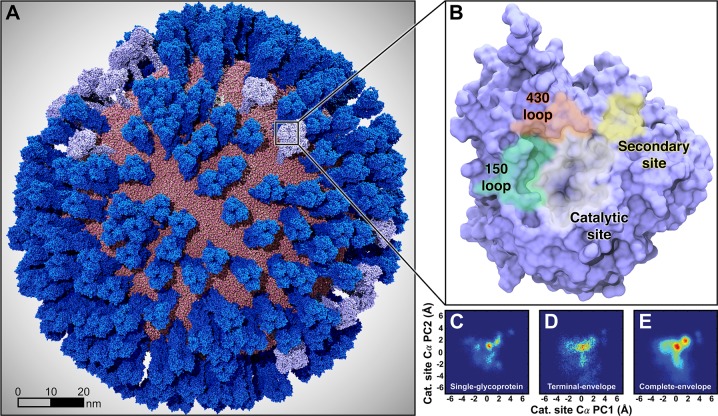
Figure 1.
Mesoscale simulations enhance conformational sampling of the viral glycoproteins. (A) A fully intact all-atom model of the influenza A H1N1 2009 (pH1N1) viral envelope, containing over 160 million atoms, shown without explicit water molecules, was simulated with all-atom MD simulations. Hemagglutinin (HA) glycoproteins shown in royal (dark) blue, neuraminidase (NA) glycoproteins shown in ice (light) blue. (B) Top view of a single NA monomer in surface representation with the catalytic site (white), secondary site (yellow), 150-loop (green), and 430-loop (red) highlighted. (C–E) Principal component analysis (PCA) was performed by considering the motions of the Cα atoms of 19 1° pocket residues. PCA histograms were independently normalized so the bins containing the minimum and maximum number of points were blue and red, respectively. (C) PCA of the four monomers sampled during a single-NA-tetramer simulation (“single-glycoprotein”). (D) PCA of the 120 monomeric trajectories extracted during the last 8.33 ns of the viral envelope simulation (“terminal-envelope”). (E) PCA of all 120 monomeric trajectories extracted from the full simulation of the viral envelope (“complete-envelope”).

