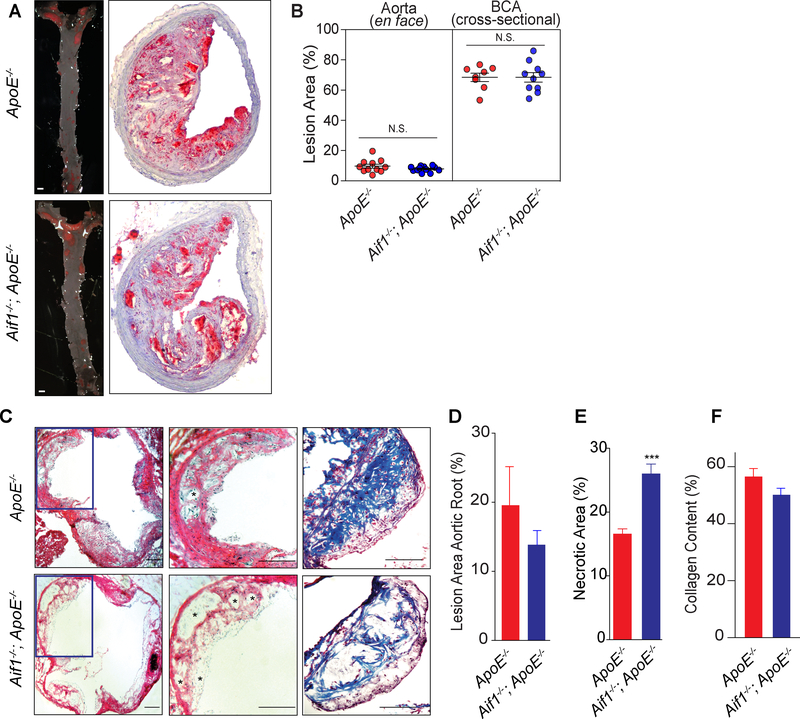
Fig. 1.
Aif1 limits necrotic core expansion without affecting atherosclerotic lesion burden in vivo.
(A) Left panel, en face Sudan IV staining of thoracoabdominal aortae harvested from ApoE−/− (n=11) and Aif1−/−;ApoE−/− (n=11) mice after 18 weeks of high fat feeding (bar, 1 mm). Right panel, representative brachiocephalic artery (BCA) lesions from ApoE−/− (n=8) and Aif1−/−;ApoE−/− (n=10) mice after 18 weeks of high fat feeding stained with ORO. (B) Left panel; quantification of the en face Sudan IV staining of aortae. Right; quantification of the ORO staining of BCAs. (C) Left panel, representative sections of hematoxylin and eosin-stained aortic root sections from ApoE−/− (n=10) and Aif1−/−;ApoE−/− (n=10) mice. The boxed areas are expanded in the middle panels (*necrotic areas; bar, 200 μM). Right panel, representative sections of Masson’s trichrome stained aortic root sections from ApoE−/− (n=10) and Aif1−/−;ApoE−/− (n=10) mice. (D) Quantification of aortic root lesion size from ApoE−/− or Aif1−/−;ApoE−/− mice. (E) Quantification of necrotic (acellular) area from ApoE−/− or Aif1−/−;ApoE−/− mice. (F) Quantification of collagen content from ApoE−/− or Aif1−/−;ApoE−/− mice. Error bars indicate ± SEM (N.S. non-significant, *** p <0.0001)

