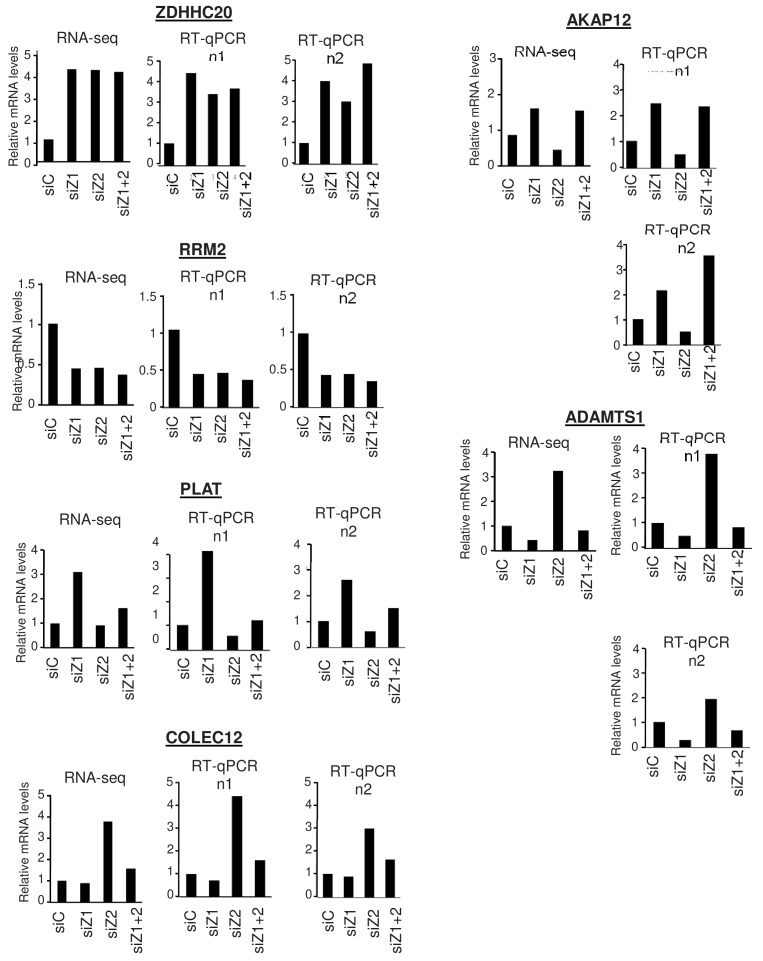
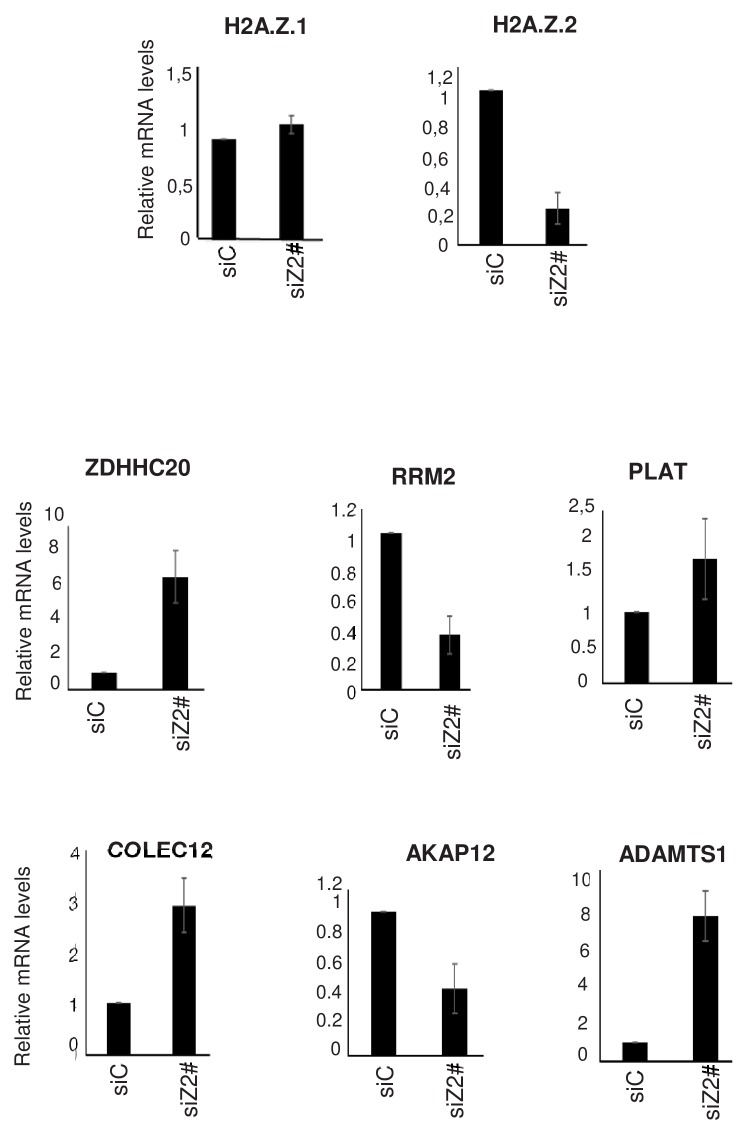
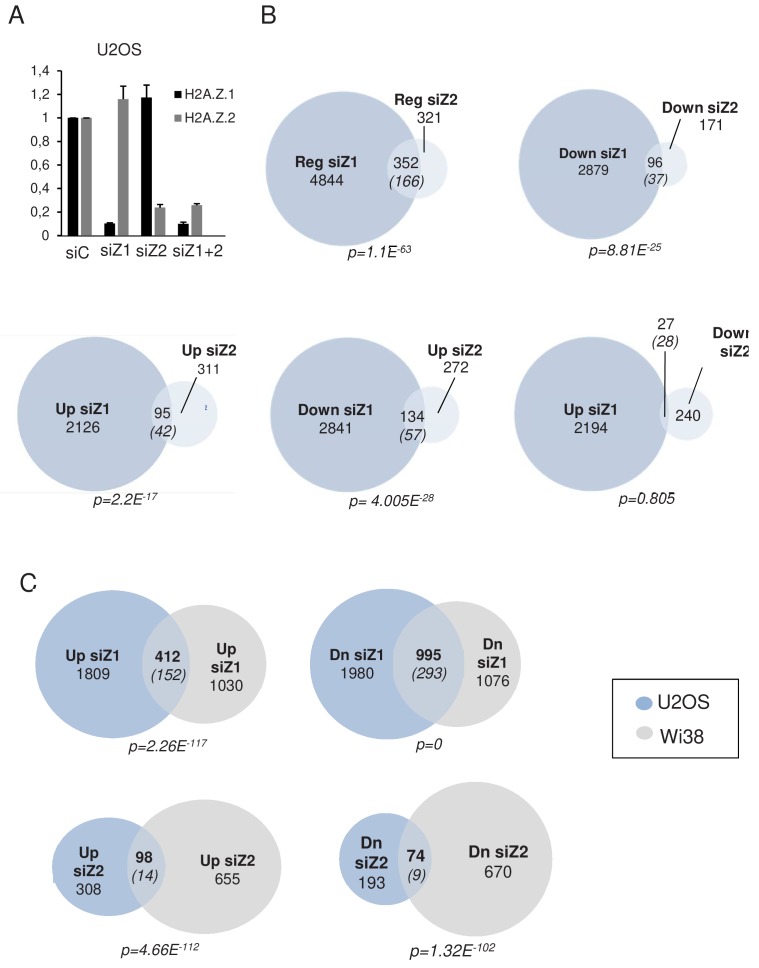
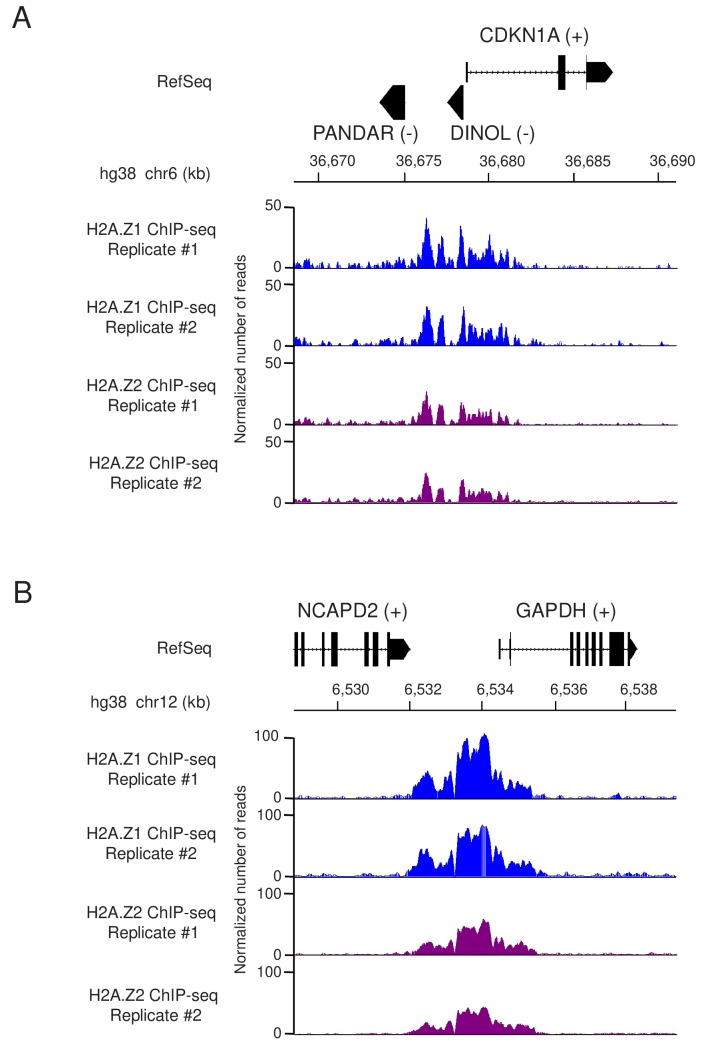
Figure 2. H2A.Z.1 and H2A.Z.2 regulate both distinct and overlapping sets of genes.
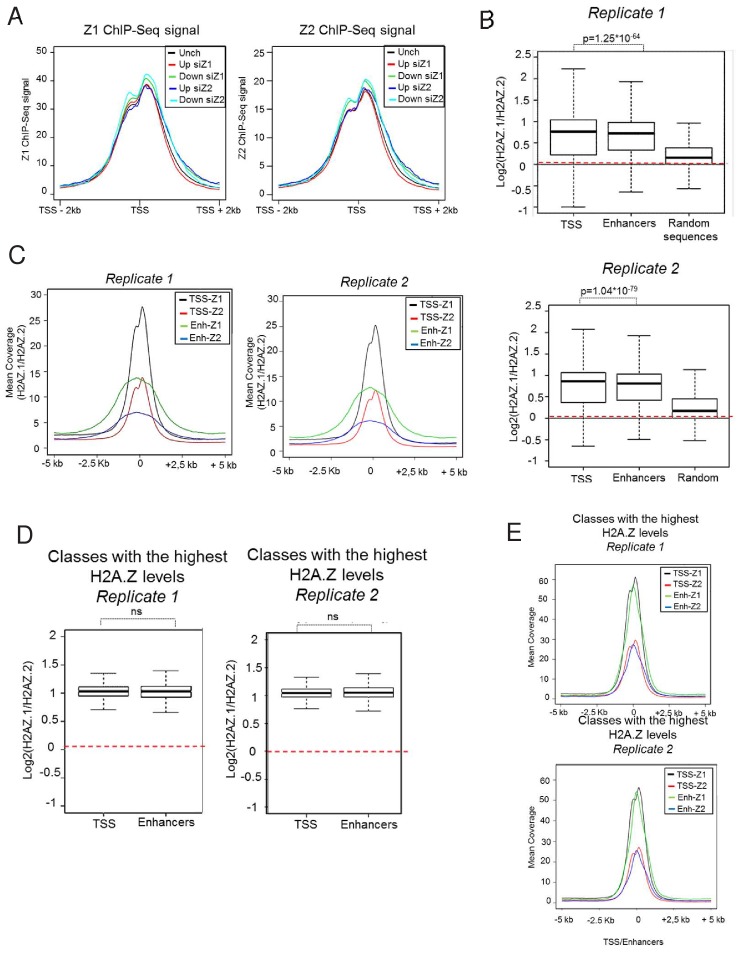
RNA-Seq data was analysed for differential gene expression in samples transfected with either H2A.Z.1 siRNA or H2A.Z.2 siRNA versus the control siRNA sample. (A) Venn diagram showing the intersection between genes differentially expressed upon H2A.Z.1 and H2A.Z.2 inhibition. The p value indicated below the diagram indicates the significance of the intersection calculated using the Chi square test considering all expressed genes. The numbers in brackets indicate the expected number of genes considering the total number of expressed genes if intersection was random. (B) Same as in A, except that the intersections indicate genes that are up-regulated or down-regulated in each sample and those that are regulated in an opposite way. Note that the intersection between genes up-regulated upon H2A.Z.1 depletion and down regulated upon H2A.Z.2 depletion is not highly significant. (C) U2OS cells expressing endogenously Flag-tagged H2A.Z.1 or H2A.Z.2 were subjected to ChIP-Seq experiments using anti-Flag antibodies. Metadata showing ChIP-Seq signals around TSS were computed for the five classes of genes (Unch: unchanged upon H2A.Z.1 or H2A.Z.2 depletion) defined from RNA-Seq data obtained in U2OS upon H2A.Z.1 or H2A.Z.2 depletion (see Figure 2—figure supplement 3). A representative experiment is shown. A replicate is shown in Fig. Figure 2—figure supplement 5A.


