. 2020 Feb 28;9:e53375. doi: 10.7554/eLife.53375

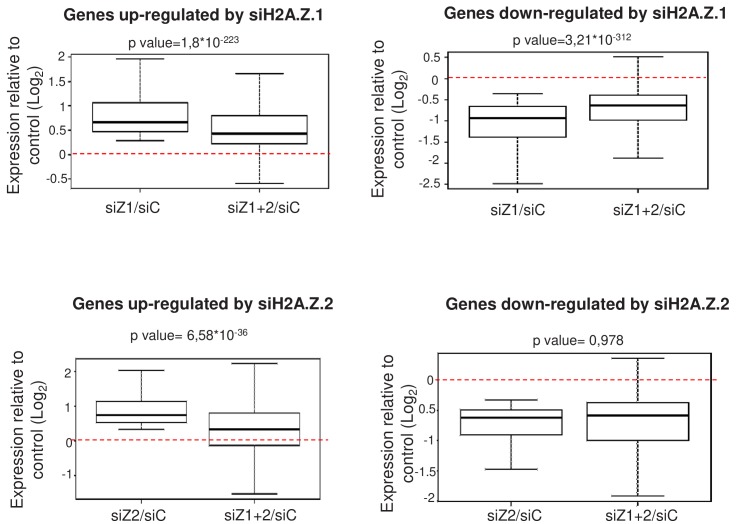
Figure 3. H2A.Z isoforms exert an antagonistic regulation on gene expression.

(A) For each gene up-regulated (left) or down-regulated (right) upon H2A.Z.1 depletion, we calculated the ratio between its expression in either H2A.Z.1 depleted cells (siZ1/siC) or cells depleted for H2A.Z.1 and H2A.Z.2 versus control cells (siZ1+2/SIC). The boxplots show the median, the 25% percentiles and the extrema of the Log2 of this ratio within the gene population (without outliers). The p value shows the significance of the difference between the two populations (paired welch test). (B) Same as in A, except that the calculation was done for genes up-regulated (left) or down-regulated (right) upon H2A.Z.2 depletion.

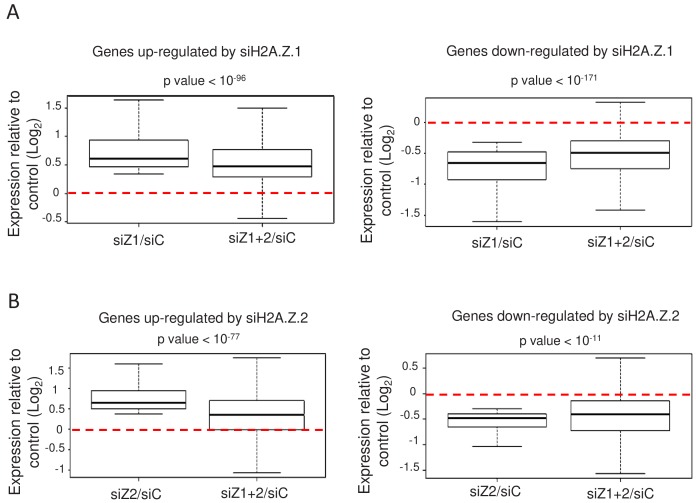
Figure 3.

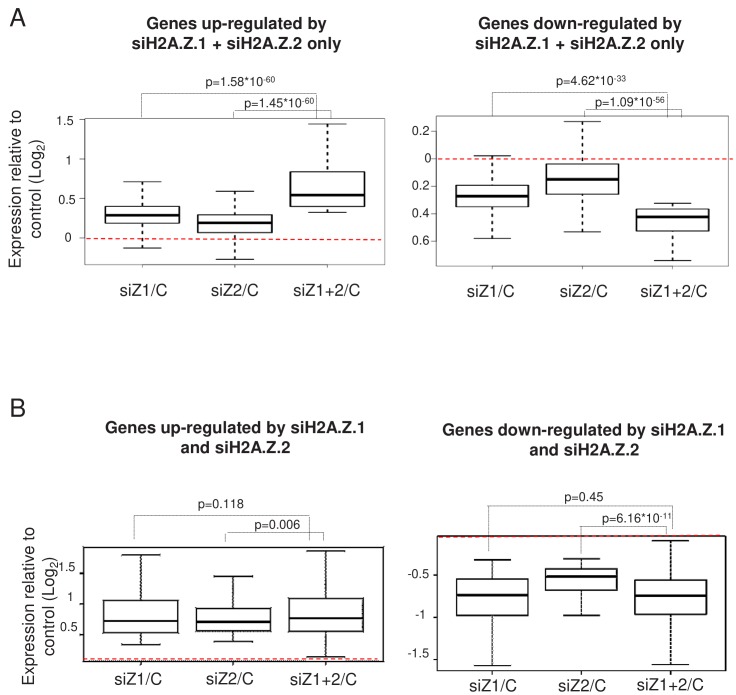
Figure 3—figure supplement 1. Effect of the double depletion of H2A.Z.1 and H2A.Z.2 on genes similarly regulated by H2A.Z.1 and H2A.Z.2.

Figure 3—figure supplement 1.

(A) For genes up-regulated (left) or down-regulated only after the combined depletion of H2A.Z.1 and H2A.Z.2, we calculated the ratio between its expression in either H2A.Z.1-depleted cell, H2A.Z.2-depleted cells, or cells depleted for H2A.Z.1 and H2A.Z.2 together versus control cells. Boxplots show the median, the 25% percentiles and the extrema within the gene population of the Log2 of this ratio (without outliers). The p value shows the significance of the difference between the two populations (paired welch test). (B) Same as in A for genes up-regulated (left) or down-regulated (right) after the depletion of H2A.Z.1 and H2A.Z.2 alone.
Figure 3—figure supplement 2. Antagonistic regulation by H2A.Z isoforms in U2OS cells.

Figure 3—figure supplement 2.

For each genes up-regulated (Top left) or down-regulated (Top, right) upon H2A.Z.1 depletion, we calculated the ratio between its expression in either H2A.Z.1 depleted cells or cells depleted for H2A.Z.1 and H2A.Z.2 versus control cells. Boxplots shows the median, the 25% percentiles and the extrema within the gene population of the Log2 of this ratio (without outliers). The p value shows the significance of the difference between the two populations (paired welch test). Bottom: genes up-regulated (left) or down-regulated (right) upon H2A.Z.2 depletion were analysed.