. 2020 Feb 28;9:e53375. doi: 10.7554/eLife.53375

Figure 5. Identification of differential H2AZ.1 and H2AZ.2 interactors.

(A) Comparison of expression levels of tagged endogenous H2A.Z.1 (heterozygous) and H2A.Z.2 (homozygous) clones used in tandem affinity purification from nuclear extracts (see Figure 5—figure supplement 1). (B) Silver stained gel of fractions obtained for the purification of H2A.Z.1 and H2A.Z.2 from nuclear extracts of K562 cells shown in (A). A mock non-tagged cell line is used as control. Flag peptide elution is obtained from the first purification step (M2-Flag resin) and biotin elution from the second final step (Strep-Tactin resin). Known components of protein complexes interacting with histone H2A.Z are identified on the right (PHF14 is also indicated). (C) Dot-blot representation of AP-MS experiments using tagged H2A.Z.1 and H2A.Z.2 as baits. Circle filling represents average spectral counts, while circle diameter represents relative enrichment in one bait versus the other and circle border represents BFDR confidence level. Known/expected partners based on the literature and large-scale public data (BioGrid) include TIP60/p400, SRCAP and HDAC complexes. Data represent two replicates for each bait and were normalized on H2AZ-H2B chaperone levels (ANP32E, NAP1L1 and NAP1L4). (D) Western-blot validation of interactions shown in (B–C). TAP-purified fractions were normalized based on Flag-H2A.Z signals, loaded on SDS-PAGE gels, and blotted with the indicated antibodies.

Figure 5.

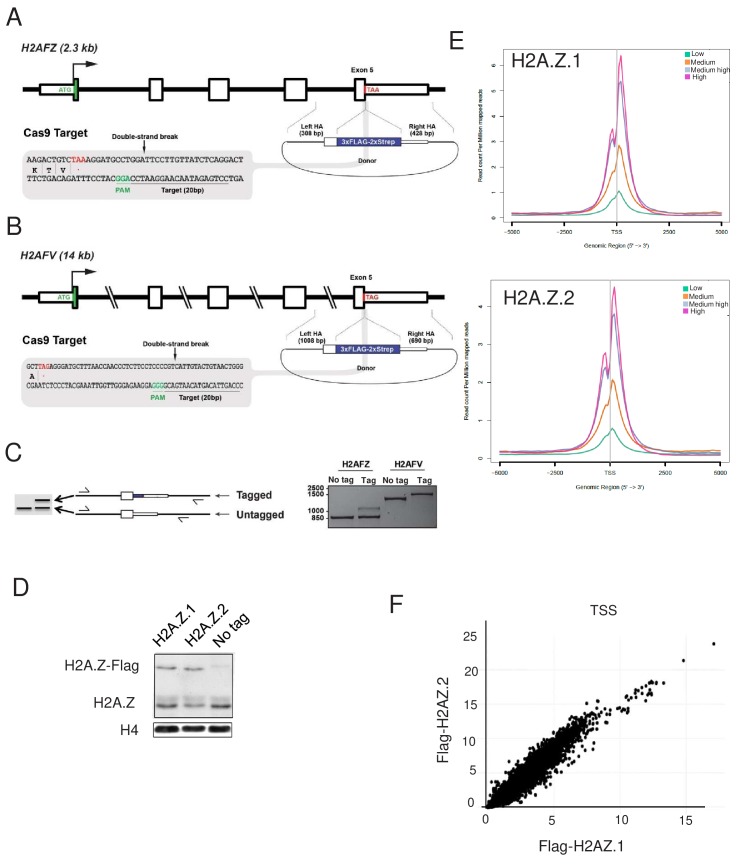
Figure 5—figure supplement 1. Tagging of H2A.Z isoforms by CRISPR/Cas9 in K562 cells used for characterisation of interactomes.

Figure 5—figure supplement 1.

(A) Schematic of the H2AFZ locus (4q23), Cas9 target site, and donor construct used to insert the 3xFlag-2xStrep tag to the C-terminus of the H2A.Z.1 protein. Annotated are the positions of the stop codon (red), the PAM (green) that specifies the cleavage site, the gRNA target sequence, and the left and right homology arms (HA) used for HR-directed insertion. (B) Schematic of the H2AFV locus (7p13), depicted as in (A). (C) Schematic and results of a PCR-based assay (out-out PCR) on genomic DNA to detect targeted integration (TI) of the tag sequence in single-cell-derived K562 clones obtained by limiting dilution. Primers are located outside of the homology arms and are designed to yield a longer PCR product if the tag is inserted, as described in Figure 1—figure supplement 1. Note that the H2A.Z.1-tagged clone is heterozygous, whereas the H2A.Z.2-tagged clone is homozygous. These two clones were used for subsequent analyses since tag expression levels were similar (D) Chromatin-enriched nuclear extracts from the indicated cell line were subjected to a total H2A.Z western blot. (E) K562 cells expressing endogenously tagged H2A.Z.1 or Z2 were subjected to a ChIP-Seq experiments. Protein-coding genes were ranked in 4 classes of equal number based on their expression levels. Meta data showing binding of H2A.Z.1 or H2A.Z.2 ChIP Seq signal around the TSS for the 4 classes of genes are shown. (F) The amount of H2A.Z.1 or Z2 in the −1000 to +1000 from each transcription start site of each protein-coding gene were calculated and plotted against each other. Note the striking correlation between the binding of Z1 and Z2.
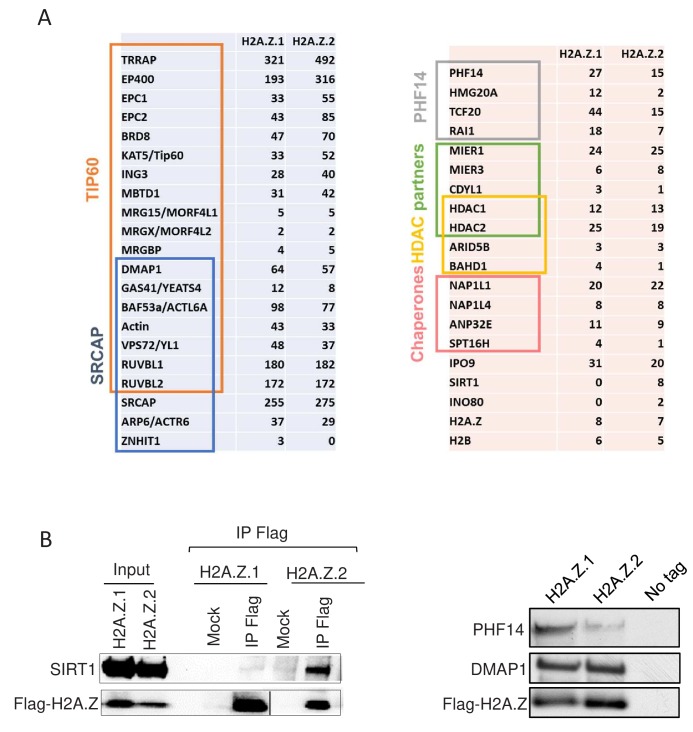
Figure 5—figure supplement 2. Mass spectrometry analysis of the H2A.Z.1/2 purifications shown in Figure 5B and validation in U2OS cells.

Figure 5—figure supplement 2.

(A) Total spectral counts obtained in one experiment with each biotin elution fraction are shown and grouped by known complexes based on the literature and BIOGRID. (B) Nuclear extracts from U2OS expressing tagged H2A.Z.1 or tagged H2A.Z.2 were subjected to an immunoprecipitation using the indicated antibody or no antibody as a control. Immunoprecipitates were analysed by western blot using anti-SIRT1 and anti-Flag antibodies. Note that despite lower expression of H2A.Z.2, more SIRT1 was found associated with it. Note that PHF14 was undetectable in these experiments (data not shown), probably because of lack of good antibodies. We thus used higher amount of cells to purify H2A.Z-isoforms interacting proteins as performed in Figure 5 for mass spectrometry analysis (see below in (C)). (C) Soluble nuclear extracts from U2OS cells expressing either tagged H2A.Z.1, tagged H2A.Z.2 or no Tag as indicated was subjected to tandem affinity purification (anti-Flag resin followed by Flag peptide elution). The amount of cells was adapted to have approximately the same amount of immunoprecipitated H2A.Z isoforms. Flag-eluted proteins were analysed by western blot using the indicated antibody. Note the higher amount of PHF14 found in the H2A.Z.1 fraction although amounts of purified H2A.Z1 and DMAP levels were higher in the H2A.Z.2 fraction.