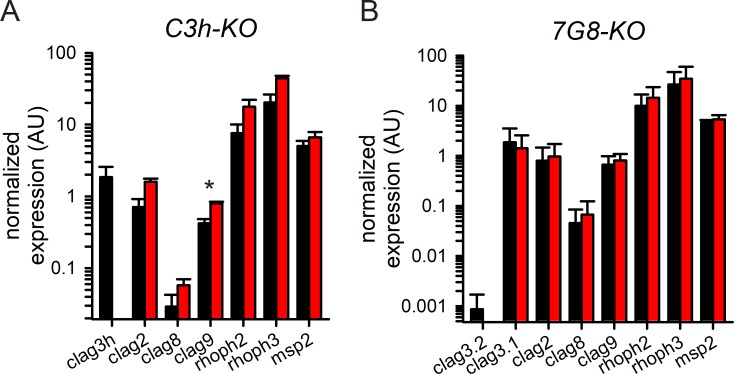
Fig 4. Modest effects on expression of clag paralogs and rhoph genes in the knockout lines.
(A) Mean ± S.E.M. normalized expression of clag and rhoph genes in KC5 and C3h-KO (black and red bars, respectively; n = 3), calculated according to 2-ΔCt using PF07_0073 as an internal control. Only clag9 exhibited a statistically significant upregulation in the Ch3-KO knockout (asterisk, P = 0.007). (B) Insignificant changes in expression of these genes in the 7G8-KO knockout when compared to 7G8 (red and black bars, respectively; n = 2–3 for each gene). The msp2 control exhibits stage-specific transcription similar to clag and rhoph genes, and is not affected in these knockout lines.

