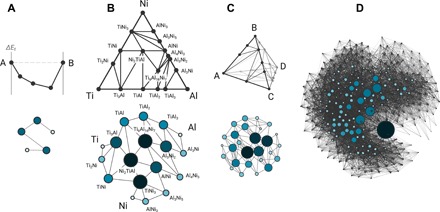
Fig. 1. Network representation of T = 0 K materials phase diagrams.

Stable phases and two-phase equilibria (tie-lines) in a phase diagram are represented as nodes and edges, respectively, to create the corresponding network: (A) Schematic A-B binary system represented as a typical two-dimensional convex hull of compound formation energies. (B) Ti-Ni-Al as an example ternary system, with the T = 0 K phase diagram shown as a Gibbs triangle. (C) Schematic A-B-C-D quaternary phase diagram shown as a Gibbs tetrahedron. (D) The 3d transition metal-chalcogen (i.e., 14-dimensional chemical space) materials network. No conventional visual representations of phase diagrams exist at higher than four dimensions. Node sizes shown are proportional to node degree.
