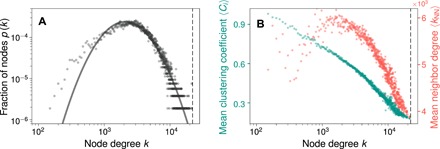
Fig. 2. Overall structure and topology of the materials network.

(A) The distribution of node degree in the materials network (gray circles) shows a heavy tail; i.e., a sizeable fraction of materials have tie-lines with nearly all other materials. A lognormal fit is shown as a solid gray line. (B) The mean local clustering coefficient 〈𝒞i〉 (green) decreases with node degree k, indicating that stable materials form local, highly connected communities. The mean neighbor degree 〈kNN〉 (red) also decreases with k, implying a weakly dissortative network behavior; i.e., materials with a large number of tie-lines connect with those with fewer tie-lines in the network. In both subplots, the vertical dashed line represents the total number of nodes (stable materials) in the network.
