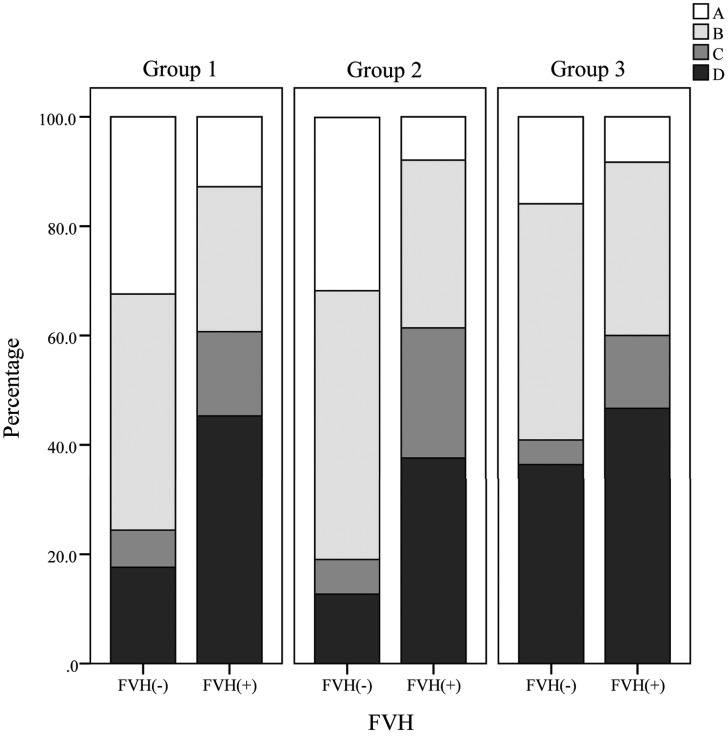
Fig 2.
Detailed middle cerebral artery signal intensity by symptom-to-MR imaging time, which increases with group number and the presence of FLAIR vascular hyperintensity. A, All M3 branches of the MCA are visualized on the cortical surface. B, One or more M3 branches are not visualized on the cortical surface. C, The superior or inferior trunk of the MCA or ≥1 M2 branch is not visualized along its course. D, M1 branches are not visualized along the course of the MCA.

