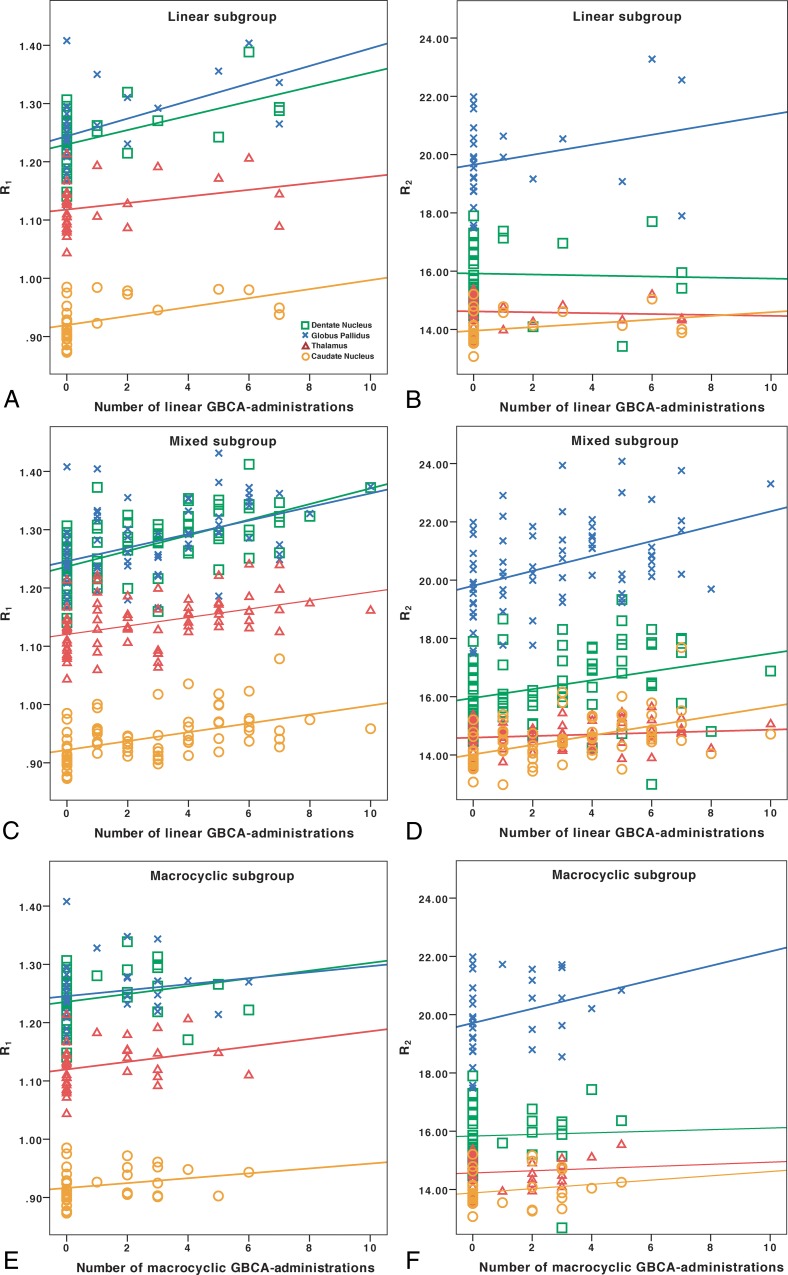
Fig 1.
Associations of R1 and R2 with the number of GBCA administrations. In the linear group, the number of linear GBCA administrations was associated with higher R1 (A), but not R2 (B). In the mixed group, the number of linear GBCA administrations was associated with both higher R1 (C) and R2 (D). The healthy controls, who had not received any GBCA administrations, are represented in each group and included in the regression analyses. The full regression analysis results are reported in Table 3. In the macrocyclic group, no significant associations were found with the number of macrocyclic GBCA administrations (E and F). The dentate nucleus is represented by green squares; the globus pallidus, by blue x's; the caudate nucleus, by orange circles; and the thalamus, by red triangles with corresponding linear regression lines. The y-axis presents the relaxation rates (R1 and R2) in seconds−1.

