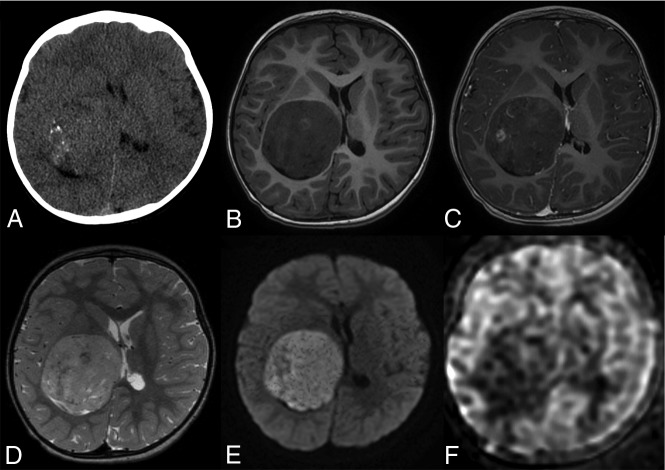
Fig 2.
Brain imaging of patient 11. Axial plane image on CT (A) shows a right thalamic mass with microcalcifications. The tumor displays hypointensity on the T1-weighted image (B), hyperintensity on the T2-weighted image (D), and weak nodular enhancement after contrast media injection (C). An intratumoral vessel is seen (C). Diffusion signal is high (E) with low ADC. Cerebral blood flow (F) is low (maximum, 46 mL/min/100 g) within the tumor.

