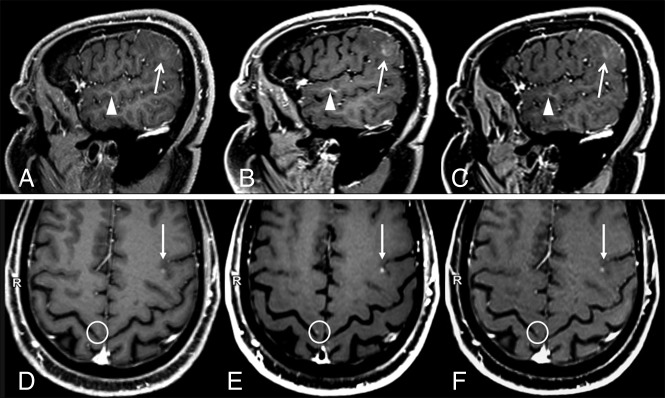
Fig 2.
Two sample cases showing differences in contrast-enhancing lesion conspicuity between sequences. A and D, MPRAGE. B and E, SPACE. C and F, VIBE. A–C, Case 1: a patient with a faintly enhancing glioblastoma. Compared with MPRAGE (A), the lesion enhancement (arrows) and its boundary demarcations are much better appreciated on SPACE and VIBE images. The corresponding contrast rate/contrast-to-noise ratio values are 24.75/2.45, 51.32/8.96, and 41.23/6.25, and the rankings are worst, best, and intermediate, respectively, for MPRAGE, SPACE, and VIBE. Also incidentally noted is a developmental venous anomaly (arrowheads), which shows a strong contrast enhancement on black-blood SPACE images. This is probably related to the extremely slow flow seen in such small venous malformations. Images were acquired at 5 minutes after contrast injection in the following order: VIBE, SPACE, MPRAGE. D–F, Case 2: a patient with metastases from renal carcinoma (D, MPRAGE. E, SPACE. F, VIBE). A small CEL is seen in the left frontal lobe (arrows) whose conspicuity with respect to the background parenchyma was ranked worst on MPRAGE, intermediate on VIBE, and best on SPACE images. The corresponding contrast rate/contrast-to-noise ratio values are 8.85/3.08, 18.96/9.15, and 16.63/6.89, respectively. An example of a very tiny metastasis in the right precentral gyrus cortex, which was missed when inspecting MPRAGE images alone but was visible on SPACE and VIBE, is highlighted by circles. This lesion was not included in the analyses. Images were acquired after 5 minutes from contrast injection in the following order: SPACE, VIBE, and MPRAGE.

