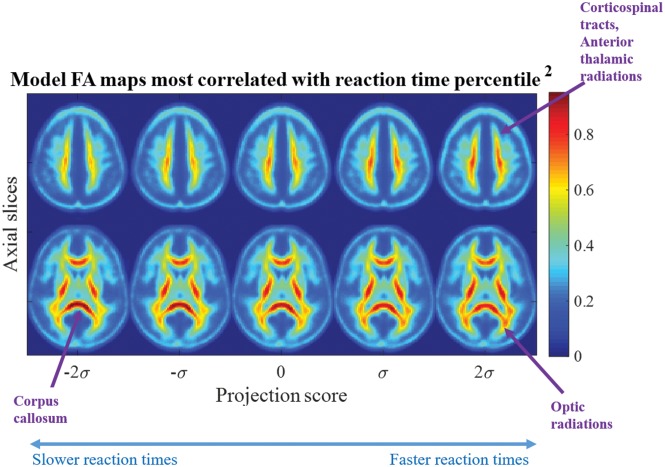
Fig 2.
Most correlated direction. Images corresponding to the most correlated direction in transport space show decreasing FA in the corticospinal tracts, anterior thalamic radiations, and optic radiations with the low reaction time percentile corresponding to the scatterplot in On-line Fig 3. The FA in the corpus callosum increases as reaction time decreases.

