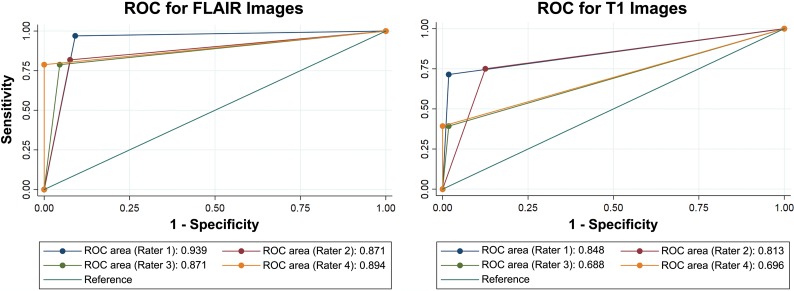
Fig 4.
ROCs for T1-weighted and FLAIR images. The receiver operating characteristic curves show better discrimination for FLAIR than for T1-weighted images. For FLAIR images, the area under the ROC curve showed that the ears of the lynx sign performed in the very good-to-excellent range for a diagnostic test.

