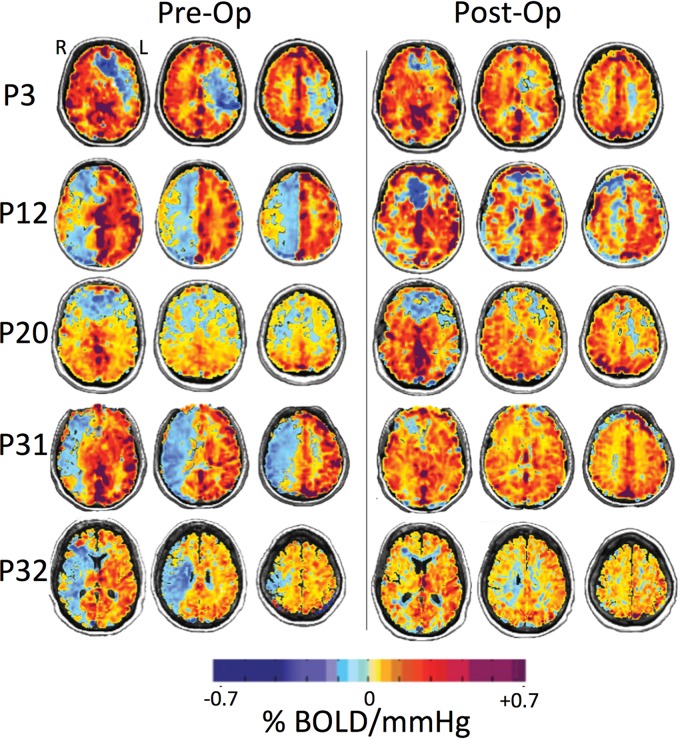
Fig 1.
BOLD MR imaging CVR maps in standard space overlaid on an anatomic T1-weighted image of 5 representative patients (P3, P12, P20, P31, and P32) who underwent a left (P3) and right (P12, P20, P31, and P32) STA-MCA bypass. The first column shows CVR maps before bypass, and the second column shows CVR maps within a 1-year follow-up after revascularization surgery. CVR units are %ΔBOLD MR signal intensity per millimeter mercury ΔPETCO2. Areas shown in blue demonstrate decreased and paradoxic (negative) CVR as shown in P3 in the left hemisphere and P12, P20, P31, and P32 in the right hemisphere (left column). The resulting CVR maps visually demonstrate improvement (reduction of steal) postbypass (right column).

