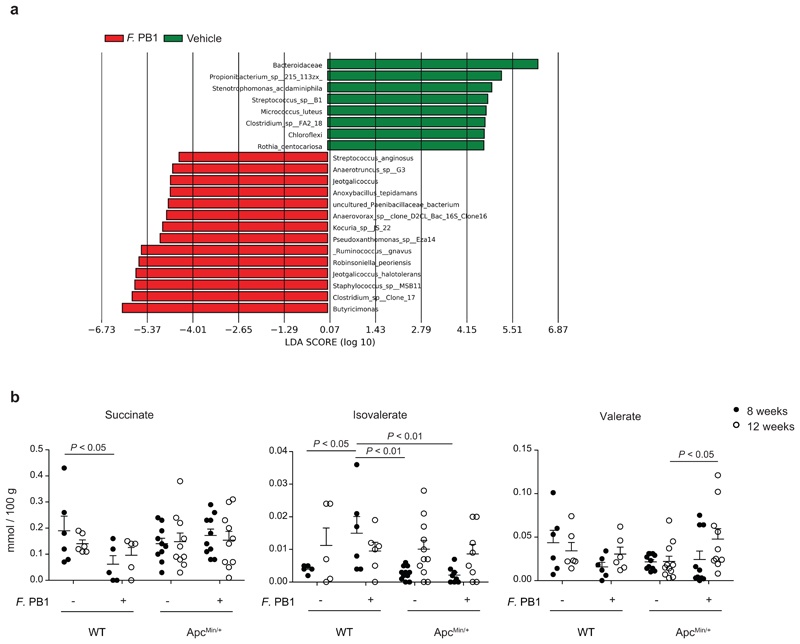
Extended Data Fig. 4. F. PB1 administration alters microbiota and its metabolic profile.
a, LEfSe comparison results between the microbiota of Vehicle and F. PB1 treated mice at 12 weeks with the highest linear discriminant analysis LDA score (log10 ≥ 2.0); Veh, n = 8; F. PB1 n = 14 mice/group. b, Fecal concentrations of succinate, isovalerate and valerate in WT and ApcMin/+ mice treated with vehicle (Veh) or F. PB1 as detected by UPLC-MS; WT Veh, WT F. PB1 n = 6; ApcMin/+ Veh n = 11; ApcMin/+ F. PB1 n = 10 mice/group. Data from two independent experiments and represented as means ± s.e.m.. P values were determined by two-way ANOVA with Bonferroni post-test.

