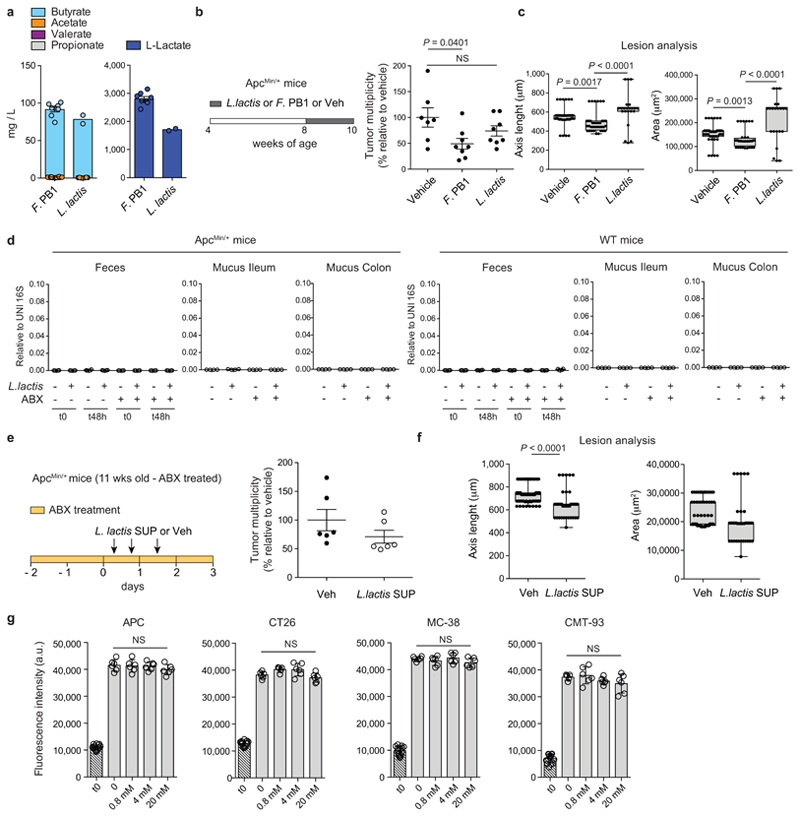
Extended Data Fig. 7. L. lactis does not colonize the mouse gut but its spent medium (SUP) has anti-tumorigenic effect in vivo.
a, Quantification of SCFAs in SUP of F. PB1 and L. lactis by UPLC-MS. Data from 2 or 6 independent experiments (L. lactis SUP n = 2; F. PB1 SUP n = 6 biologically independent experiments). b,c, ApcMin/+ mice received vehicle (Veh, n = 7 mice/group), F. PB1 or L. lactis (n = 8 mice/group) from week 8 to 10. b,Tumor multiplicity in the small intestine normalized to vehicle treated ApcMin/+ mice. c, Area and maximum diameter (axis length) of ileal dysplastic lesions normalized to the total number of lesions per mouse. Box plots show the interquartile range, median value and whiskers min to max. d, qPCR of L. lactis abundance normalized to panbacterial primers targeting the 16S rRNA gene (UNI 16S) in bacterial DNA extracted from feces (both at time 0 and 48h after last gavage) and mucus from the ileum and colon of WT and ApcMin/+ mice pretreated or not with antibiotics (ABX) and then monocolonized with L. lactis (n = 4 mice/group). e,f, 11 weeks old ApcMin/+ mice treated with broths not fermented (Veh) or fermented by L. lactis (SUP) in the presence of ABX (n = 6 mice/group). e, Tumor multiplicity in the small intestine normalized to vehicle treated ApcMin/+ mice. f, Area and maximum diameter of ileal dysplastic lesions normalized to the total number lesions per mouse. Box plots show the interquartile range, median value and whiskers min to max. g, Cell proliferation assay on mouse CRC cell lines treated or not with sodium lactate at different concentrations for 48h. t0 is the signal from cells at the time of stimulation. Two independent experiments were performed with consistent results. Data presented as means ± s.d. of a representative experiment (n = 6 biologically independent samples). P values were determined by two-tailed unpaired Mann-Whitney test (e,f), one-way ANOVA with Bonferroni post-test (b,g) or Kruskal-Wallis test with Dunn post-test (c,d). Data are presented as means ± s.e.m. in a-f.

