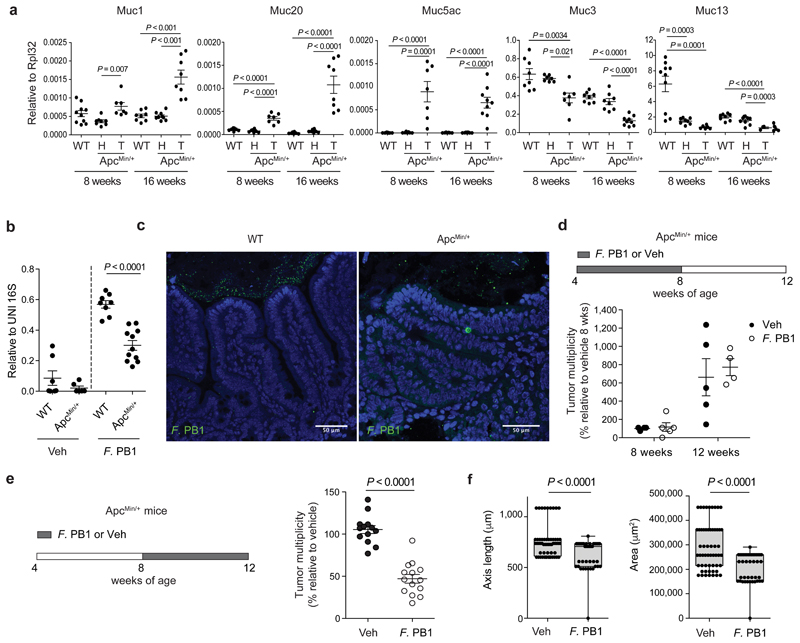
Fig. 2. F. PB1 loss coincides with mucus changes and when reintroduced reduces tumor growth.
a, qPCR of mucin expression in the ileal tissue of WT mice and healthy (H) and tumor (T) tissue of ApcMin/+ mice at 8 and 16 weeks of age. Expression levels normalized to the reference gene Rpl32. Data from two independent experiments (8wks: WT n = 10, ApcMin/+ H n = 8, ApcMin/+ T n = 7; 16 wks: WT n = 8, ApcMin/+ H n = 9, ApcMin/+ T n = 9 mice/group). P values were determined by one-way ANOVA with Bonferroni post-test to compare expression levels within the same time point. b,c, F. PB1 administration experiments in WT and ApcMin/+ mice pre-treated with antibiotic cocktail. b, qPCR of F. PB1 abundance normalized to panbacterial primers targeting the 16S rRNA gene (UNI 16S) in bacterial DNA extracted from ileal mucus. Data from two independent experiments (WT Veh n = 7; WT F. PB1 n = 10; ApcMin/+ Veh n = 6; ApcMin/+ F. PB1 n = 11 mice/group). P values were determined by two-tailed unpaired Mann-Whitney test. c, Representative FISH images of F. PB1 (green) on the mucosal surface of ApcMin/+ ileum polyp and WT normal ileum. DAPI nuclear stain in blue. Images obtained at 40X magnification, scale bars 50 μm; n = 3 mice/group. d, Tumor multiplicity in the small intestine of ApcMin/+ mice treated with vehicle (Veh) or F. PB1 from week 4 to 8 (n = 5 mice/group). Significance determined by multiple t-tests corrected for multiple comparisons using the Holm-Sidak method to compare tumor multiplicity between groups at each time point. e,f, ApcMin/+ mice received vehicle (Veh) or F. PB1 from week 8 to 12. Two independent experiments were performed with consistent results. e, Tumor multiplicity in the small intestine normalized to vehicle treated ApcMin/+ mice at 12 weeks of age. Data from two independent experiments (n = 14 mice/group). f, Area and maximum diameter (axis length) of ileal dysplastic lesions normalized to the total number of lesions per mouse. Data from one representative experiment (n = 7 mice/group). Box plots show the interquartile range, median value and whiskers min to max. P values were determined by two-tailed unpaired t-test (e) and two-tailed unpaired Mann-Whitney test (f). a,b,d-f, Data are represented as means ± s.e.m.

