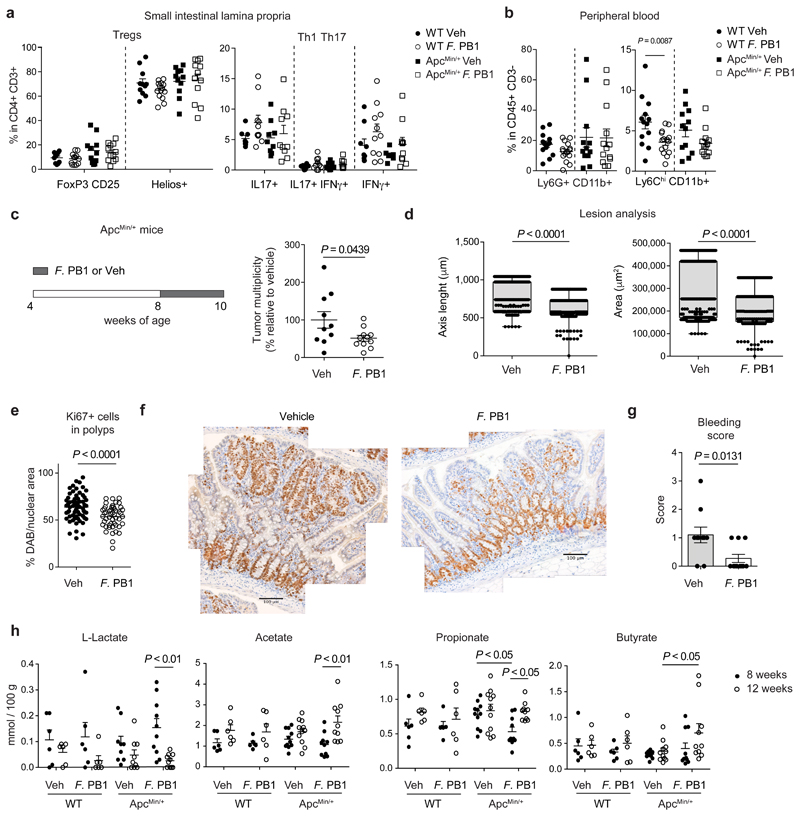
Fig. 3. F. PB1 reduces tumor cell proliferation without major impact on immune cells.
a,b, WT and ApcMin/+ mice treated with vehicle (Veh) or F. PB1 from week 8 to 12. a, Flow cytometric analysis of T regulatory, Th1 and Th17 cell populations in the small intestinal lamina propria. FoxP3+CD25+ are gated on the live CD45+ CD3+ CD4+ cells; Helios+ is gated on the FoxP3+ CD25+ cells (WT Veh, ApcMin/+ F. PB1 n = 12; WT F. PB1 n = 14; ApcMin/+ Veh n = 11 mice/group); IL17+, IFNγ+ and IL17+ IFNγ+ cells are gated on the live CD45+ CD3+ CD4+ cells (WT Veh, ApcMin/+ Veh n = 9; WT F. PB1 n = 11; ApcMin/+ F. PB1 n = 10 mice/group). b, Flow cytometric analysis of peripheral blood cells. Percentages are relative to the CD45+ CD3- population; WT Veh, ApcMin/+ F. PB1 n = 13; WT F. PB1 n = 15; ApcMin/+ Veh n = 12 mice/group. c-g, ApcMin/+ mice received vehicle (Veh) or F. PB1 from week 8 to 10. Data from two independent experiments depicted. c, Tumor multiplicity in the small intestine normalized to vehicle treated ApcMin/+ mice (Veh n = 10; F. PB1 n = 11 mice/group). d, Area and maximum diameter (axis length) of ileal dysplastic lesions (number of lesions: Veh = 265; F. PB1 = 150) normalized to the total number of lesions per mouse. Box plots show the interquartile range, median value and whiskers min to max (Veh n = 10; F. PB1 n = 11 mice/group). e, Percentage of nuclear Ki67 positive cells in the polyps of Veh and F. PB1-treated mice; n = 4 mice/group. f, Representative images of nuclear Ki67 staining in polyps of Veh and F. PB1-treated mice. Scale bars 100 μm. n = 4 mice/group. g, Bleeding score of Veh and F. PB1-treated mice (Veh n = 10; F. PB1 n = 11 mice/group). h, Fecal concentrations of L-lactate, acetate, propionate and butyrate in WT and ApcMin/+ mice treated with Veh or F. PB1 from 8 to 12 weeks, detected by UPLC-MS; WT Veh, WT F. PB1 n = 6; ApcMin/+ Veh n = 11; ApcMin/+ F. PB1 n = 10 mice/group.
a-d,g,h, Data from two independent experiments are represented as means ± s.e.m.. P values were assessed by one-way ANOVA using Bonferroni post-test for multiple comparisons (a) or two-tailed unpaired t-test (b,c,e,g), two-tailed unpaired Mann-Whitney test (d), or two-way ANOVA with Bonferroni post-test for multiple comparisons (h).

