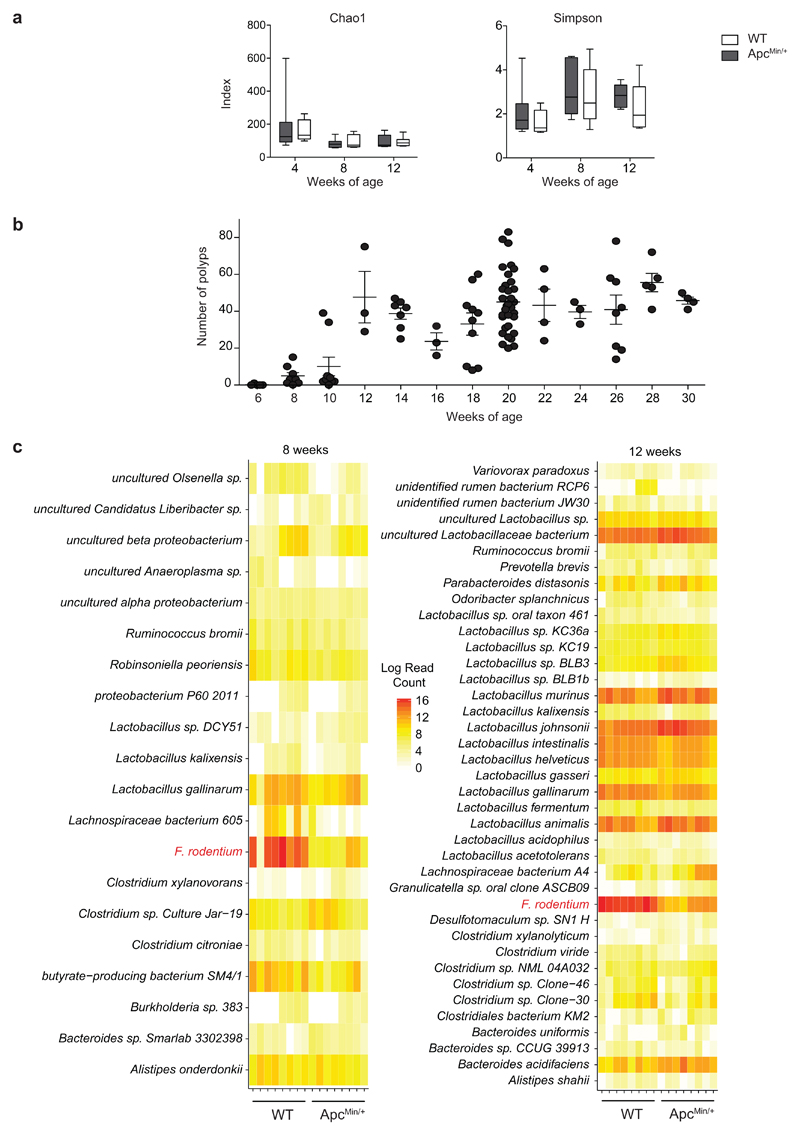
Extended Data Fig. 1. Fecal microbiota diversity upon tumor progression in ApcMin/+ mice.
a, Chao1 and Simpson indexes of the fecal microbiota of WT and ApcMin/+ mice; n = 8 mice/group. Box plots show the interquartile range, median value and whiskers min to max. Data from two independent experiments. b, Tumor multiplicity in the small intestine of ApcMin/+ mice assessed at different time points; wks 6, 28 n = 5; wks 8, 26 n = 8; wks 10 n = 9; wks 12, 16, 24 n = 3; wks 14 n = 7; wks 18 n = 10; wks 20 n = 33; wks 22, 30 n = 4 mice/group. c, Normalized read counts for differentially represented species in WT and ApcMin/+ mice shown as heatmaps. The counts were log transformed and used to define the color gradient of the heatmap; n = 8 mice/group. Data from two independent experiments. a-c, Data are represented as means ± s.e.m..

