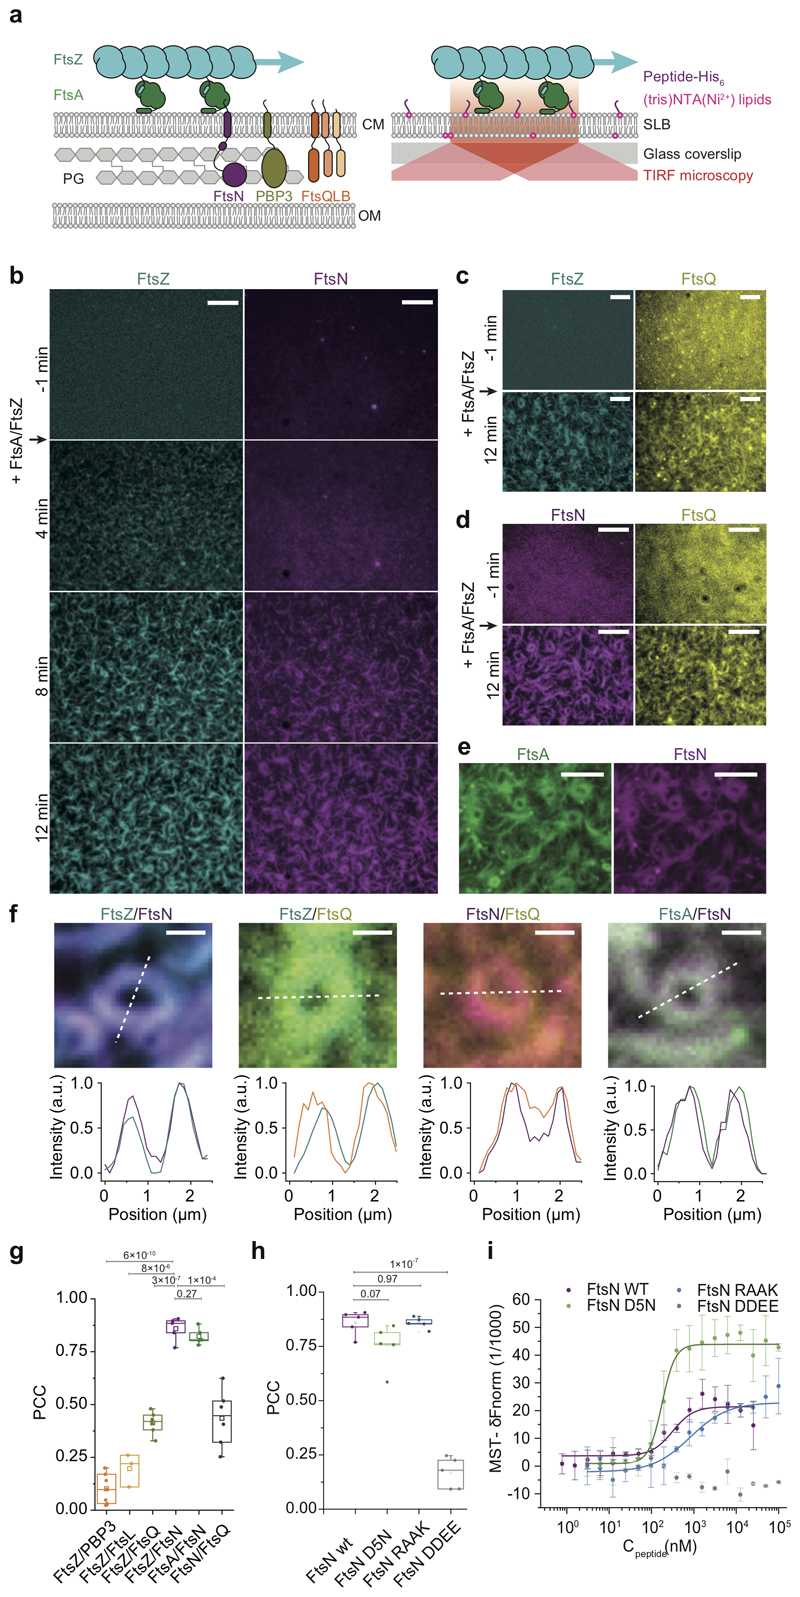
Figure 1. FtsZ-FtsA filaments co-localize with cytoplasmic tails of FtsN and FtsQ.
a. Left: Selected proteins of the E. coli cell division machinery. FtsZ-FtsA co-filaments on the cytoplasmic membrane (CM) interact with the N-terminal cytoplasmic tails of FtsN, PBP3 and FtsQLB. These proteins act on the peptidoglycan (PG) layer in the periplasm between CM and outer membrane (OM). Right: In vitro reconstitution approach. N-terminal peptides of candidate proteins were attached to the surface of glass-supported lipid bilayers (SLBs). Arrows indicate treadmilling direction of FtsZ filaments.
b. From a homogeneous distribution, CF488-FtsNcytoHis (magenta) colocalizes with FtsZ filaments on the membrane after addition of Cy5-FtsZ (cyan) and FtsA at t = 0 min. Representative micrograph from n=5 independent experiments. Scale bars are 5 μm. Supplementary Video 1.
c. Representative micrograph of Alexa488-FtsZ (cyan) and Cy5-FtsQcytoHis (yellow) with unlabeled FtsA from n=5 independent experiments. Scale bars are 5 μm. Supplementary Video 2.
d. Representative micrograph of Alexa488-FtsNcytoHis (magenta) and Cy5-FtsQcytoHis (yellow) with unlabeled FtsA and FtsZ (12 min) from n=6 independent experiments. Scale bars are 5 μm. Supplementary Video 3.
e. Representative micrograph of Cy5-FtsNcytoHis (magenta) on TMR-FtsA (green) from n=4 independent experiments Scale bars are 5 μm. Supplementary Video 4.
f. Top: Ring-like structures formed by Cy5-FtsZ/CF488-FtsNcytoHis (n=5), Alexa 488-FtsZ/Cy5-FtsQcytoHis (n=5), Alexa488-FtsNcytoHis /Cy5- FtsQcytoHis (n=6) and TMR-FtsA/Cy5- FtsNcytoHis (n=4). Bottom: Corresponding intensity profiles along dashed lines. Scale bars are 1 μm.
g Colocalization of membrane-bound peptides quantified by the Pearson Correlation coefficient (PCC, mean±SD and n are specified in ED Fig.9). Each dot represents an independent experiment.
h. Colocalization efficiency of different versions of FtsN with FtsZ. Each dot represents an independent experiment.
i. FtsN peptides bind to FtsA with different affinities as measured by Microscale Thermophoresis. wild-type FtsN peptide. FtsNcyto-DDEEHis shows no interaction. Solid lines indicate fit of Hill equation. Error bars represent standard deviation between n=3 independent experiments.

