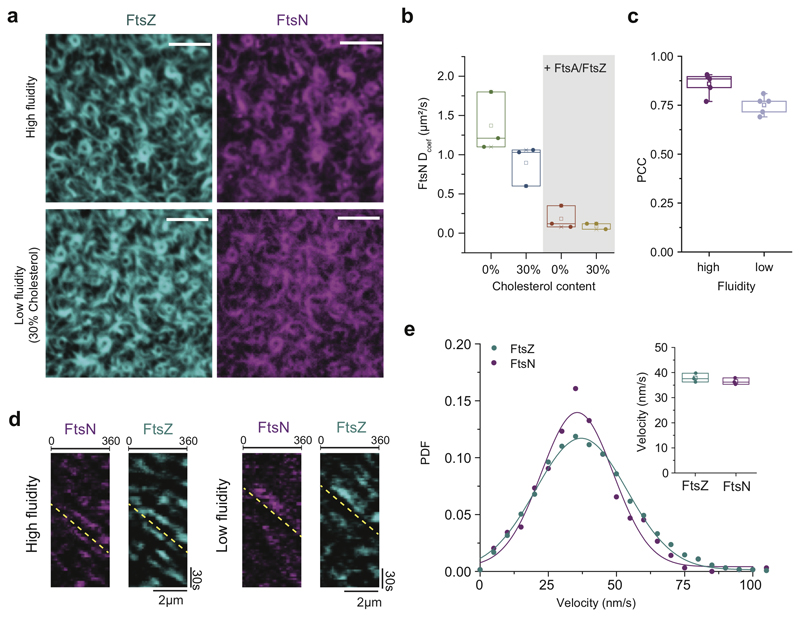
Extended Data Fig. 7. Decrease in membrane fluidity does not affect colocalization and comigration with treadmilling FtsZ filaments.
a. The FtsZ filament pattern and colocalization with FtsNcytoHis is not affected on low fluidity membranes (supplemented with 30% cholesterol), n=3, Scale bars are 5 μm.
b. Addition of cholesterol to a standard lipid composition slows down diffusion of FtsNcytoHis, n=3 (bulk diffusion constant obtained from FRAP profile analysis) Dcoef FtsNcyto-His0%Chol = 1.37 ± 0.31 Dcoef FtsNcyto-His30%Chol = 0.90 ± 0.21. After addition of FtsA and FtsZ, FtsNcytoHis shows the same diffusion constant on high and low fluidity membranes as diffusion is limited due to interaction with FtsZ/FtsA cofilaments. Dcoef FtsNcyto-His0%Chol = 0.18 ± 0.12 Dcoef FtsNcyto-His30%Chol = 0.10 ± 0.03; mean ± SD.
c Colocalization analysis reveals that a decrease in membrane fluidity does not affect colocalization efficiency between FtsNcytoHis and FtsZ, n=5.
d. Differential kymographs, n=3 and e. treadmilling analysis (n=3) of FtsZ and FtsN co-migration on low-fluidity membranes with 30% cholesterol. Velocity histograms and fit to a Gaussian distribution (solid line) did not reveal any significant difference in the velocities of FtsZ (v = 35.6 ± 13.2 nm/s; n = 3; cyan) and FtsN (v = 37.1 ± 16.8 nm/s; n = 3; magenta) on low fluidity membranes, p-value = 0.33. The velocity values represent mean and SD from the corresponding Gaussian fits (R2 = 0.97-0.99). The boxes indicate the 25–75th percentiles, whiskers the outliers, the midline indicates the median and square indicates the mean. P-value was calculated using a two-tailed Student’s t-test for parametric distributions.

