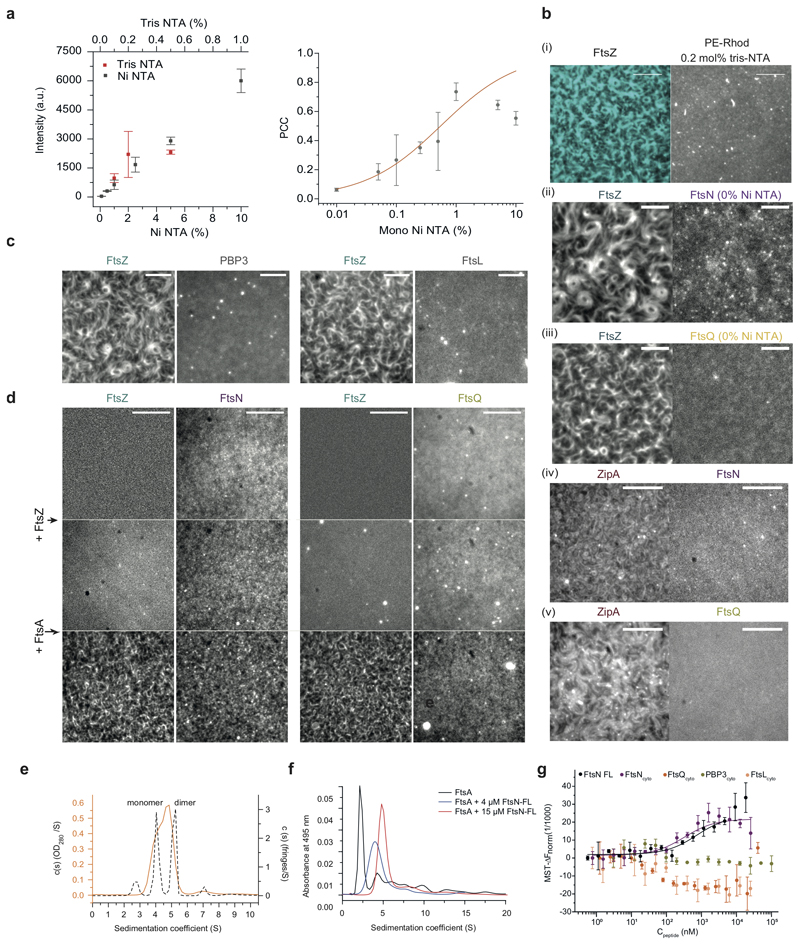
Extended Data Fig. 1. Colocalization of FtsNcytoHis and FtsQcytoHis with FtsZ filaments depends on their interaction with FtsA.
a. Left: The surface density of FtsNcytoHis scales linearly with density of mono-Ni-NTA (black dots) and tris-NTA-NTA lipids (red dots, mean±SD, n=3 or higher). Right: Colocalization efficiency of FtsNcytoHis to FtsA-FtsZ filaments at increasing concentrations of mono-Ni-NTA (mean±SD, n=3 or higher).
b.(i) The FtsZ pattern is not affected at 0.2 mol% tris-Ni-NTA (or mono-Ni-NTA at 1 mol%), n=5. Scale bars are 5 μm. (ii) FtsNcytoHis (0.5 μM) in solution does not affect the FtsZ-FtsA cofilament pattern and shows only weak binding to FtsA/FtsZ filaments, n=5. Scale bars are 10 μm. (iii) FtsQcytoHis shows no colocalization to FtsZ filaments (cyan) on membranes without Ni-NTA. Scale bars are 10 μm, n=3. (iv-v) FtsNcytoHis and FtsQcytoHis do not colocalize with FtsZ filaments when FtsA is replaced by ZipA, n=3. Scale bars are 5 μm.
c. PBP3cytoHis and FtsLcytoHis attached to 0.2 mol% tris-Ni-NTA lipid membrane remained homogeneously distributed in the presence of FtsA-FtsZ filaments. Representative micrographs from n=7 (PBP3) and n=3 (FtsL) independent experiments. Scale bars are 5 μm.
d. FtsNcytoHis does not interact with FtsZ. After addition of 0.5 μM FtsA in the same experiment FtsNcytoHis and FtsZ are organized into cytoskeleton patterns. A similar experiment was performed with FtsQcytoHis, n=3. Scale bars are 5 μm.
e. Sedimentation velocity (SV) characterization of protein-detergent complexes formed by the solubilization of 16 μM full-length FtsN in 3.72 mM DDM. Sedimentation velocity c(s) distributions obtained from the analysis of the absorbance (orange line) and Raleigh interference (grey dashed line) signals of FtsN complexes using the program SEDFIT. Main peaks at 4.1 ± 0.1 and 5.2 ± 0.1 S detected by Raleigh interference (short dash line, n=3) are compatible with FtsN monomers and dimers.
f. SV analysis of AlexaFluor488FtsA in the presence of full-length FtsN at a 1:1 FtsA:FtsN molar ratio (blue) and a ~1:4 FtsA:FtsN molar ratio (red), or in the absence of FtsN (black). The main peak of FtsA at ~2 S shifts to a higher s-value upon addition of FtsN, indicating the formation of higher molecular weight species, n=2.
g. Binding curves obtained by MST of Alexa647-FtsA titrated with corresponding peptides. Binding was observed only for FtsNcytoHis and FtsN-FL, n=3. See Extended Data 10 for fitting results.

