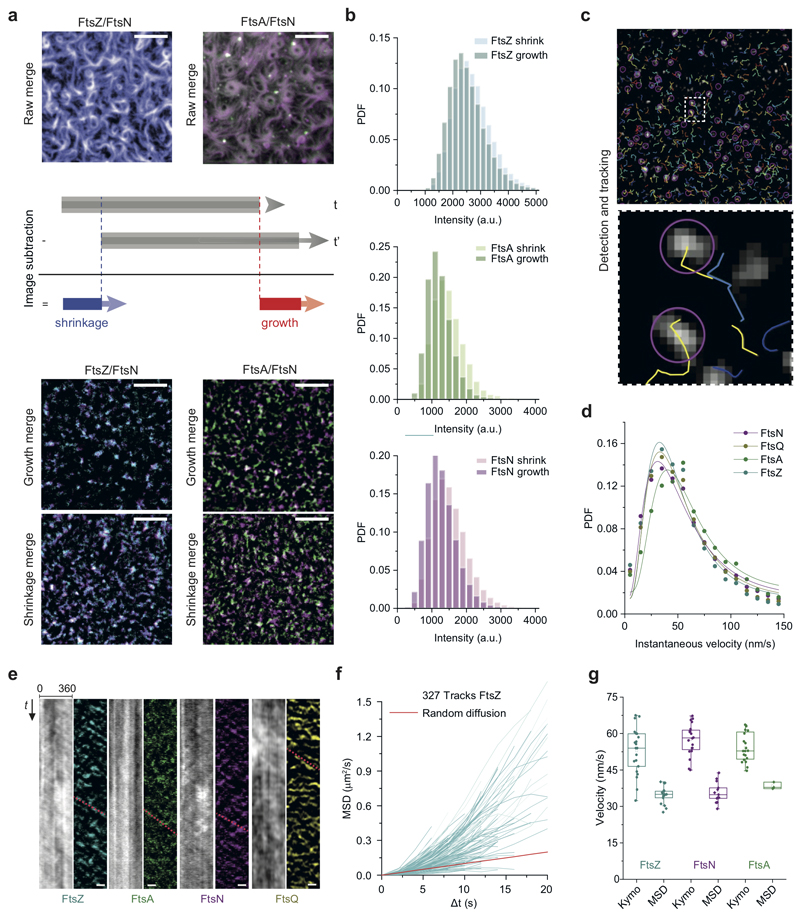
Extended Data Fig. 3. Differential imaging of protein patterns.
a. Top: Representative pre-processed micrographs showing the pattern of FtsZ and FtsNcytoHis as well as FtsA and FtsNcytoHis. Middle: Illustration of image subtraction process to obtain a differential image. Bottom: Fluorescent spots corresponding to growing and shrinking ends of FtsZ filament bundles and associated proteins. Micrographs show representative results from n=16 independent experiments with FtsZ/FtsN and n=3 for FtsA/FtsN. Scale bars are 5 μm.
b. Fluorescence intensity histograms for spots of FtsZ, FtsA and FtsNcytoHis from one representative experiment. The histograms for growth and shrinkage showed similar distributions and intensities, suggesting symmetric behavior with a small shift towards brighter values for the shrinking ends.
c. Differential image of fluorescent spots overlaid with result from detection (purple circles) and tracking (coloured lines). Represent image from more more than 20 independent experiments.
d. Instantaneous velocities of fluorescent spots (growth) of FtsNcytoHis and FtsQcytoHis, FtsZ and FtsA and lognormal fits. FtsZ (v = 42.6 ± 32.1 nm/s, mean±SD; n = 16; cyan), FtsA (v = 50.1 ± 33.5 nm/s; n = 3; green, p-value = 0.10), FtsQcytoHis (v = 46.8 ± 37.1 nm/s; n = 3; dark yellow, p-value = 0.21) and FtsNcytoHis (v = 44.3 ± 38.2 nm/s; n = 13, magenta, p-value = 0.94). P-values were calculated using a two-tailed Student’s t-test for parametric distributions.
e. Kymographs obtained from raw and differential movies of FtsZ, FtsA, FtsNcytoHis and FtsQcytoHis, illustrating that image subtraction simplifies detection of the dynamic behavior, representative kymographs from n=20 rings.
f. Mean-squared displacement calculated for individual trajectories. Positive slope corresponds to directed motion, red straight line illustrates diffusive behavior.
g. Comparison between different methods for treadmilling speed quantification: directly from kymographs (Kymo, n = 20 from 3 (FtsA) and 5 (FtsN and FtsZ) independent experiments) and from automated treadmilling analysis via differential imaging (MSD, n(FtsZ) = 16 independent experiments with 30398 tracks total, n(FtsN) = 13 independent experiments with 20809 tracks total, n(FtsA) = 3 independent experiments with 3964 tracks total). The boxes indicate the 25–75th percentiles, whiskers the outliers, the midline indicates the median and square indicates the mean.

