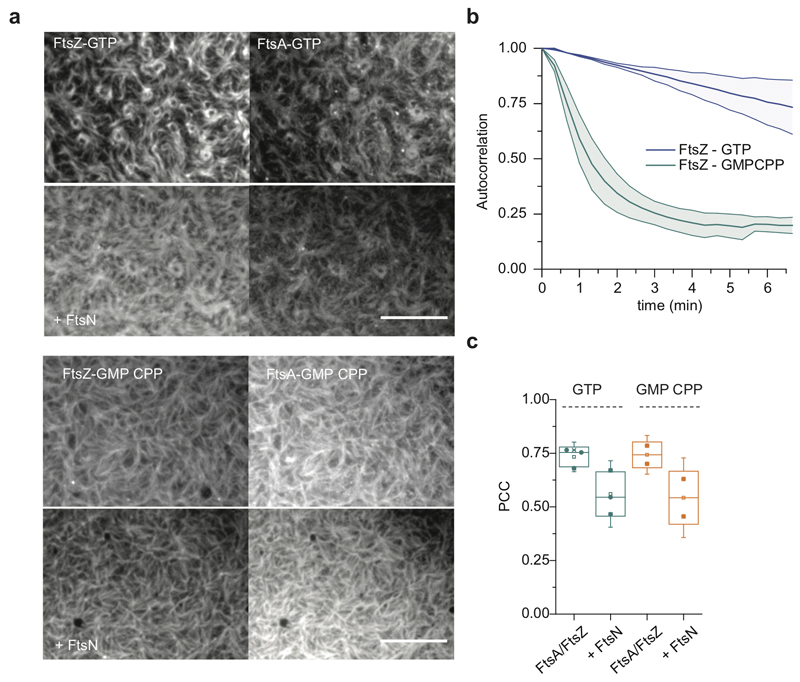
Extended Data Fig. 4. GMP CPP slows down filament reorganization dynamics, but does not affect colocalization between FtsZ and FtsA.
a. Filament patterns formed by FtsZ and FtsA in the presence of either GTP (top, n=3) or GMP CPP (bottom, n=2) before and after FtsNcyto-His addition. Scale bars are 10μm.
b. Reorganization dynamics of the FtsZ filament pattern is slowed down in the presence of GMPCPP compared to pattern formed with GTP. Graph shows temporal autocorrelation of fluorescence time lapse movies, fast decay indicates rapid reorganization. n=3 (GTP), n=2 (GMPCPP). Line represents the mean, error bars the standard deviation.
c. PCC quantification reveals comparable colocalization between FtsZ and FtsA in the presence of different nucleotides. The presence of FtsN decreases PCC value, however this decrease is nucleotide-independent (n=3 (GTP), n=2 (GMPCPP). The boxes indicate the 25–75th percentiles, whiskers the outliers, the midline indicates the median and square indicates the mean.

