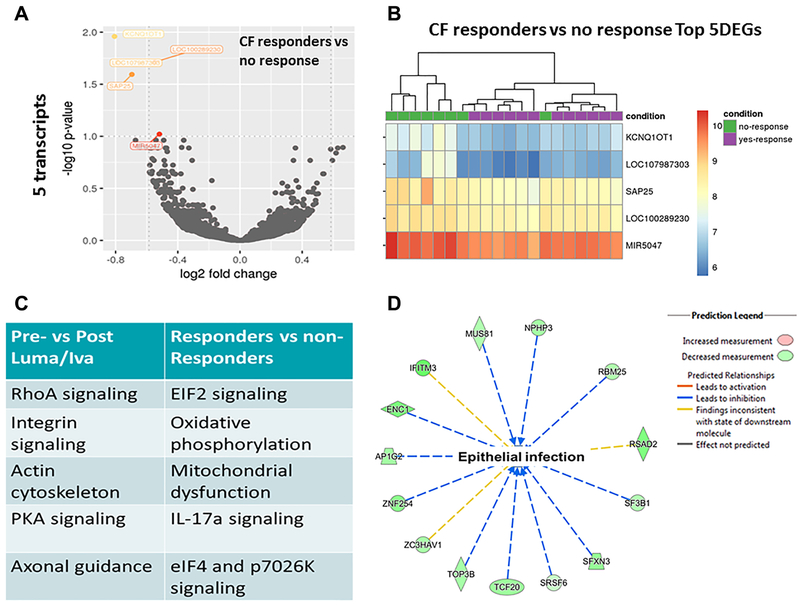
Figure 5: Clinical responders have altered gene expression profiles.
A) Volcano plot of changes in RNA-Seq gene expression profiles for CF patients post-lumacaftor/ivacaftor who were clinical responders (n=12) vs non-responders (n=8, defined by FEV1 and BMI change). B) Heat map of top differentially expressed genes for CF patients post-lumacaftor/ivacaftor clinical responders compared to non-responders. C) Top canonical pathways of gene expression analysis for pre/post lumacaftor/ivacaftor and clinical responder comparisons. D) Representative network analysis for predicted changes in susceptibility to epithelial infection in CF clinical responders compared to not responders. A colored prediction legend is listed.

