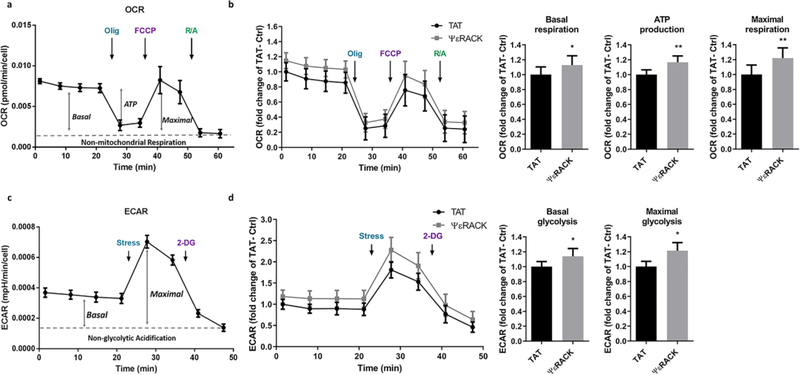
Fig. 1. Activation of PKCε increases the respiratory and glycolytic rate in primary neurons.
(a) Representative profile of the oxygen consumption rate (OCR) showing the sequential injection of metabolic inhibitors: complex V inhibition by oligomycin (Olig), mitochondrial uncoupling by FCCP, complex I and complex III inhibition by rotenone and antimycin (R/A); arrow indicates application. Basal: Basal respiration rate; ATP: oxygen consumption rate linked to ATP production; Maximal: maximal uncoupled respiration rate. (b) Primary neurons were exposed to control -TAT or specific PKCε activator-ΨεRACK (500 nM) for 1 hour. OCR was measured 48 hours later using the Seahorse Analyzer. Values were normalized to cell counts and represented as fold change of TAT control (n=4, mean ± SEM, *P<0.05, Two-tailed paired Student’s t-test). (c) Representative profile of the extracellular acidification rate (ECAR) showing the sequential injection of metabolic inhibitors. Energetic stress cocktail: complex V inhibition by oligomycin and mitochondrial uncoupling by FCCP; glycolysis inhibition by 2-Deoxyglucose (2-DG); arrow indicates application. Basal: Basal glycolysis rate; Maximal: maximal glycolytic rate. (d) Primary neurons were treated with TAT or ΨεRACK (500 nM) for 1 hour. ECAR was measured 48 hours later using the Seahorse Analyzer. Values were normalized to cell counts and represented as fold change of TAT control (n=4, mean ± SEM, * P <0.05, Two-tailed paired Student’s t-test).

