Figure 2.

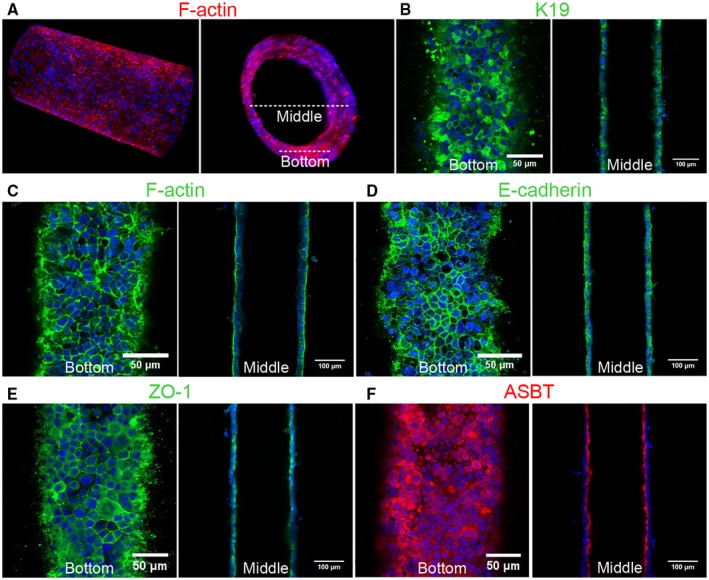
Characterization of a channel lined with mouse cholangiocytes (cell line). (A) Representative confocal images of cholangiocytes in the bile duct‐on‐a‐chip forming a monolayer within the cylindrical channel, stained for F‐actin (red) and nuclei (DAPI; blue). Longitudinal (left panel) and cross‐sectional (right panel) views. White dashed lines indicate the bottom surface and cross‐section through the center shown in the remaining panels. (B‐F) Immunofluorescent images across the bottom (left panels in B‐F) and middle (right panels in B‐F) of the channel stained with antibodies against (B) K19, (C) F‐actin, (D) E‐cadherin, (E) ZO‐1, and (F) the ASBT. Nuclei shown by DAPI staining (blue). Images are representative of at least three independently constructed devices for each condition. Scale bars: 50 μm, left panels; 100 μm, right panels.
