
Figure 6.
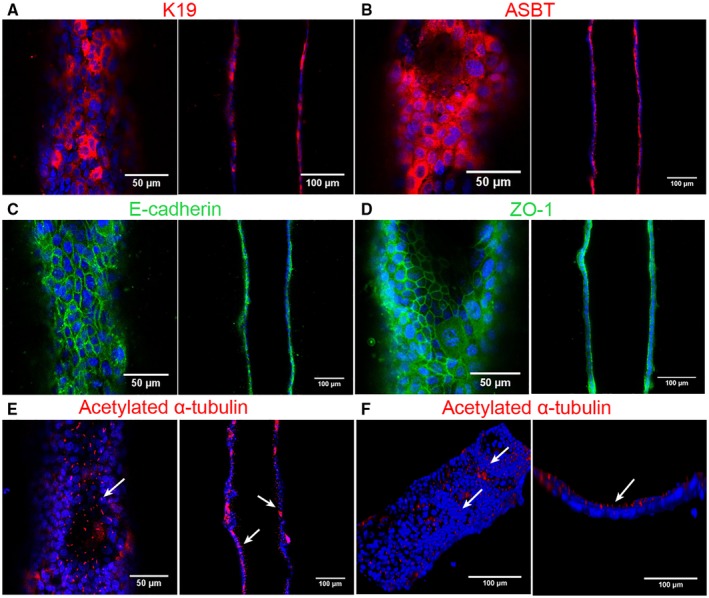
Bile duct‐on‐a‐chip with primary murine extrahepatic cholangiocytes. Immunofluorescence images across the bottom (left panels) and middle (right panels) of channels stained with antibodies (shown in red or green) against (A) K19, (B) ASBT, (C) E‐cadherin, (D) ZO‐1, and (E,F) acetylated α‐tubulin, with DAPI nuclear staining (blue). Top (left panel, F) and cross‐sectional (right panel, F) views of cilia (white arrow) in the cholangiocyte channel. Scale bars, 50 μm (left panels, except F); 100 μm (right panels and F, left panel). Images are representative of three independent experiments.