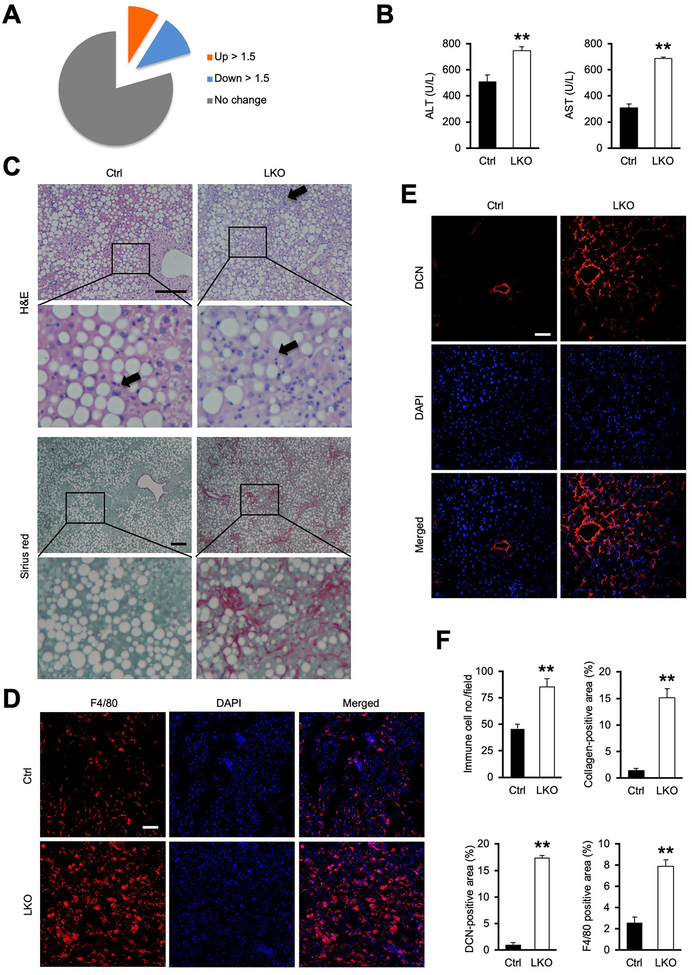
Figure 1. Hepatocyte-specific inactivation of hnRNPU exacerbates CDAHFD-induced NASH.
(A) Pie chart depicting NASH regulation of the liver genes containing binding sites for hnRNPU.
(B) Plasma ALT and AST levels.
(C) H&E and Sirius red staining of liver sections from mice fed CDAHFD for three weeks. Arrowheads indicate infiltrated immune cells. Scale bars: 200 μm.
(D) F4/80 immunofluorescence staining of liver sections. Scale bars: 100 μm.
(E) DCN immunofluorescence staining of liver sections. Scale bars: 100 μm.
(F) Quantification of immune cell infiltration, collagen deposition, and DCN- and F4/80-positive areas. Data in (B) and (F) represent mean ± SEM (Ctrl n=8; LKO n=6). **P<0.01, Ctrl vs. LKO, two-tailed unpaired Student’s t-test.

