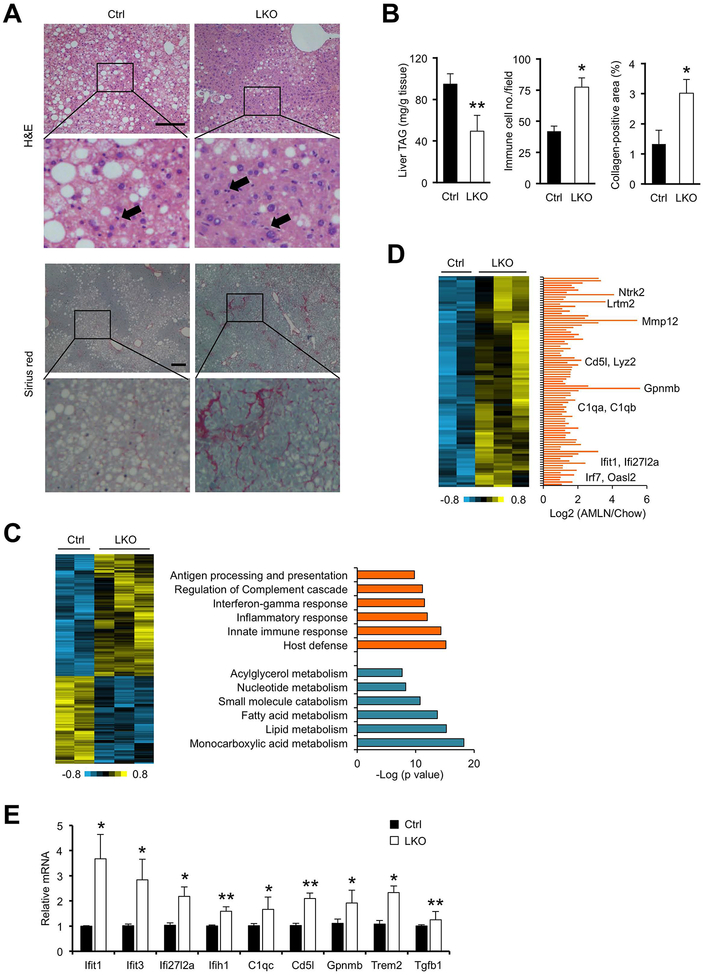
Figure 2. hnRNPU deficiency worsens NASH pathologies in mice following HFD feeding.
(A) H&E and Sirius red staining of liver sections. Arrowheads indicate infiltrated immune cells. Scale bars: 200 μm.
(B) Quantification of liver TAG content, immune cell infiltration, and collagen deposition.
(C) Heat map of hepatic genes upregulated or downregulated in hnRNPU LKO mice (left). Enrichment of biological processes in these two clusters is indicated (right).
(D) A cluster of hepatic genes upregulated in HFD-fed LKO mice (heat map, left) and following AMLN diet-induced NASH (bar graph, right). Liver RNA-seq data from mice fed chow or AMLN diet were used for the bar graph.
(E) qPCR analysis of hepatic gene expression in HFD-fed mice (Ctrl n=6; LKO n=10). Data in (B) and (C) represent mean ± SEM. *P<0.05, **P<0.01; Ctrl vs. LKO, two-tailed unpaired Student’s t-test.

