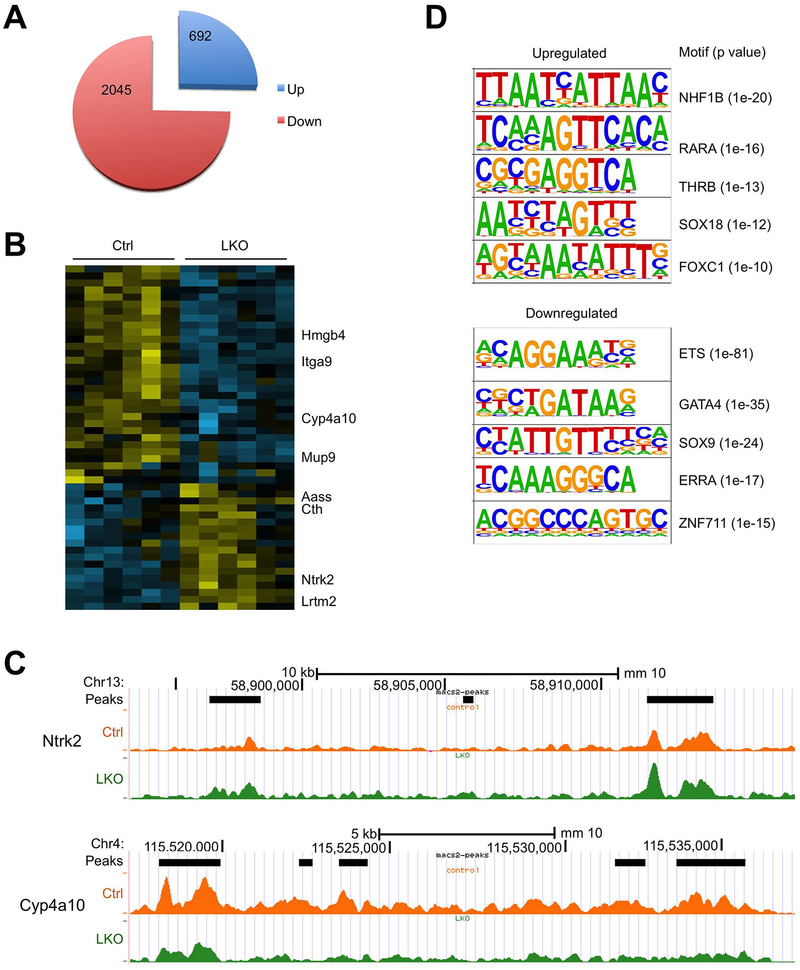
Figure 3. ATAC-seq analysis of liver chromatin accessibility.
ATAC-seq was performed on liver nuclei isolated from Ctrl (n=6) and LKO (n=6) mice after six months of HFD feeding.
(A) Pie chart showing ATAC-seq peaks altered by hnRNPU deficiency.
(B) Heat map representation of peaks increased or decreased by over 2-fold in hnRNPU LKO mouse livers.
(C) UCSC genome browser tracks near Ntrk2 and Cyp4a10.
(D) Motif-enrichment analysis of the upregulated and downregulated ATAC-seq peaks.

