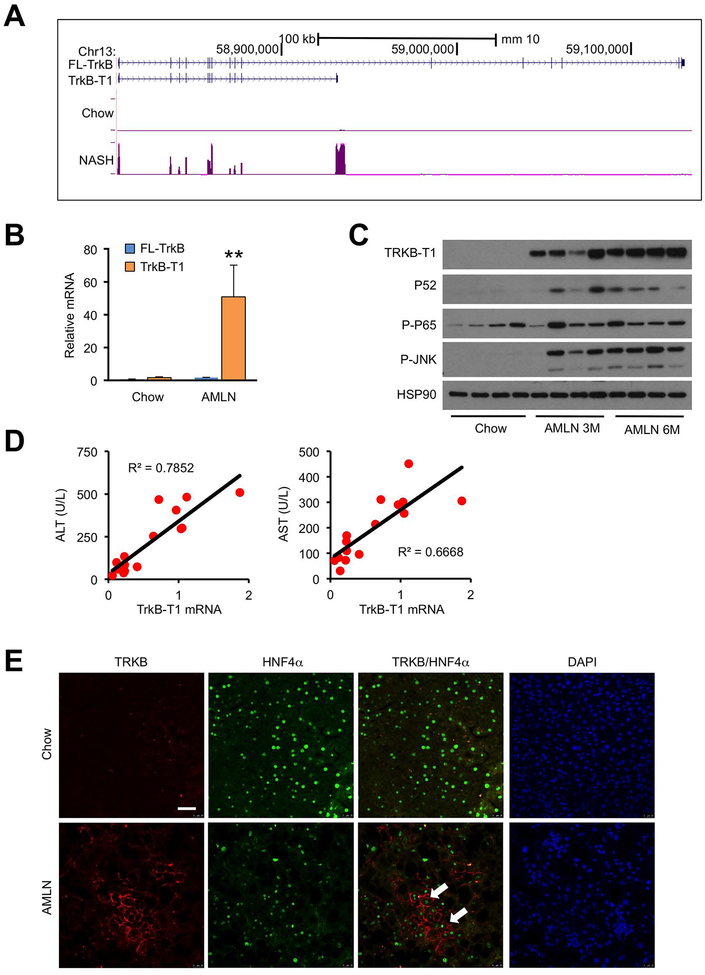
Figure 5. Induction of TrkB-T1 expression in mouse NASH.
(A) UCSC genome browser view of Ntrk2 liver RNA-seq reads from mice fed chow or AMLN diet (n=3).
(B) qPCR analysis of TrkB isoforms in the liver from mice fed chow or AMLN diet (n=3) using isoform-specific primers. Data represent mean ± SEM. *P<0.05, **P<0.01; AMLN vs. chow, two-tailed unpaired Student’s t-test.
(C) Immunoblots of total liver lysates from chow or ALMN diet-fed mice.
(D) Correlation of liver TrkB-T1 mRNA expression with plasma ALT and AST in a cohort of AMLN diet-fed WT mice exhibiting different severity of liver injury (n=15).
(E) Representative TrkB immunofluorescence in chow and AMLN diet-fed mouse livers. Arrowheads indicate HNF4α-positive hepatocytes. Scale bars: 100 μm

