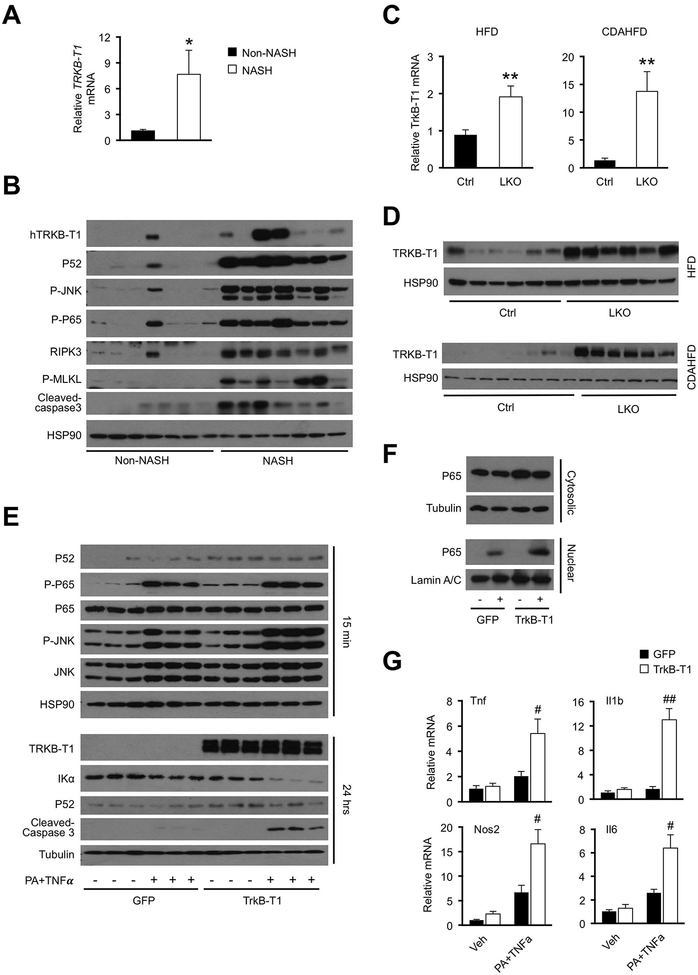
Figure 6. Regulation and functional role of TRKB-T1 in hepatocyte stress response.
(A) qPCR analysis of TRKB-T1 expression in liver biopsies obtained from non-NASH control (n=7) and NASH patients (n=7). Data represent mean ± SEM. *P<0.05, NASH vs. control, two-tailed unpaired Student’s t-test.
(B) Immunoblots of total liver lysates from non-NASH and NASH individuals.
(C) qPCR analysis of liver TrkB-T1 expression in control and hnRNPU LKO mice fed HFD (Ctrl n=6; LKO n=10) or CDAHFD (Ctrl n=8; LKO n=6). Data represent mean ± SEM. **P<0.01, LKO vs. Ctrl, two-tailed unpaired Student’s t-test.
(D) Immunoblots of total liver lysates from mice fed HFD or CDAHFD.
(E) Immunoblots of total cell lysates from primary hepatocytes transduced with GFP or TrkB-T1 adenovirus followed by treatment with vehicle (−) or PA+TNFα (+) for 15 min (top) or 24 hrs (bottom).
(F) Immunoblots of cytosolic or nuclear extracts from transduced hepatocytes treated with vehicle (−) or PA+TNFα (+) for 15 min.
(G) qPCR analysis of gene expression in transduced hepatocytes treated with vehicle (Veh) or PA+TNFα for 6 hrs (n=3). Data represent mean ± SEM. #P<0.05, ##P<0.01, TrkB-T1 vs. GFP in hepatocytes treated with PA+TNFα. Two-way ANOVA with multiple comparisons.

