
Figure 1.
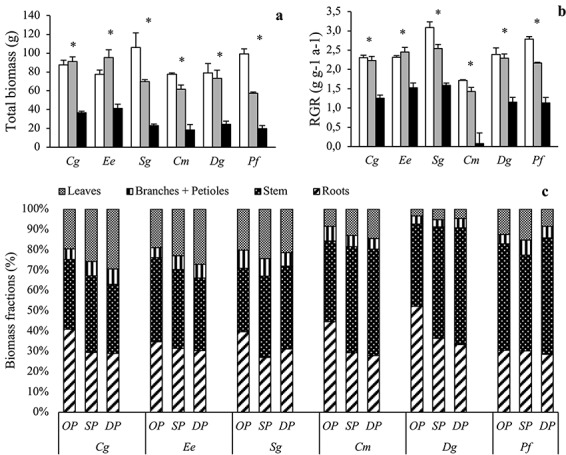
(a) Total biomass (g), (b) relative growth rate (RGR) and (c) biomass allocation (%) of Carapa grandiflora (Cg), Entandrophragma excelsum (Ee), Syzygium guineense (Sg), Croton megalocarpus (Cm), Dombeya goetzenii (Dg) and Polyscias fulva (Pf) planted in open (white in a, b; OP in c), sparse canopy (gray in a, b; SP in c) and dense canopy (black in a, b; DP in c) plots. Species to the left (Cg, Ee, Sg) are shade tolerant and species to the right (Cm, Dg, Pf) shade-intolerant. Leaf biomass data represent leaves attached at the time of harvest. The error bars represent standard errors (n = 3). The symbol * in (a) and (b) indicates significant variation among radiation regimes within a species. Overall statistics results are provided in Table 2.