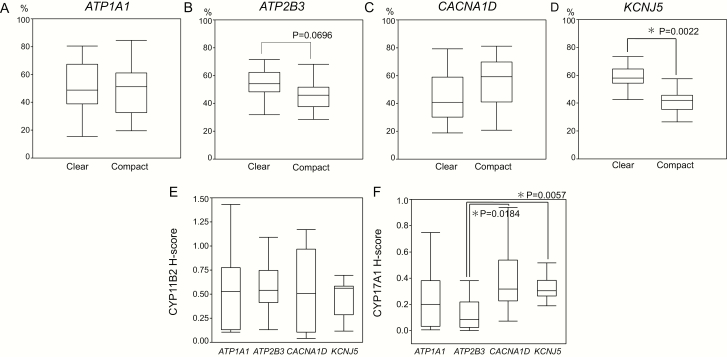
Figure 3.
Comparison of clear and compact tumor cell ratios in ATP1A1-, ATP2B3-, CACNA1D-, and KCNJ5-mutated aldosterone-producing adrenocortical adenomas (APAs) (A–D). The ratio of the clear cell component tended to be more abundant than the compact cell component in ATP2B3-mutated APAs (54.3% [48.2–62.4%]; versus 45.7% [37.6–51.8%]; P = .0696). In KCNJ5-mutated APAs, the clear cell component was significantly much higher than the compact cell component [59.8% (54.4%–64.6%) versus 40.2% (35.4%–45.6%); P = .0022]. Comparison of the H-score of CYP11B2 and CYP17A1 among ATP1A1-, ATP2B3-, CACNA1D-, and KCNJ5-mutated APAs (E,F). The status of CYP17A immunoreactivity was significant different between KCNJ5 and ATP2B3 (P = .0057), as well as between ATP2B3- and CACNA1D-mutated APAs (P = .0184).

