
Fig. 9.
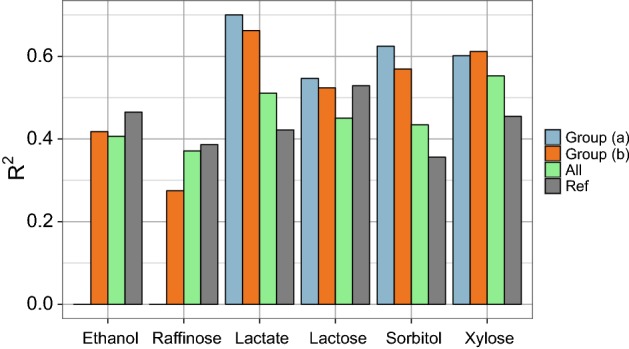
RF prediction accuracy ( on a test set) for individual traits when trained on group (a) (blue bars), group (b) (orange bars) and all of the 46 traits (green bars) compared to reference results (grey bars), when both learning and prediction was performed on individual traits