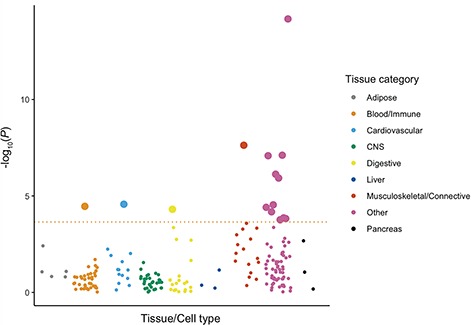
Figure 1. Multi-tissue enrichment analysis results for endometriosis risk loci. Each dot represents a tissue or cell type from either the GTEx dataset (total N = 8550) or the Franke lab dataset (total N = 37 427) and each colour represents a different tissue category. Tissues or cell types passing the FDR cut off (FDR < 0.05) with a –log10 P-value < 3.65 are shown as large dots.

