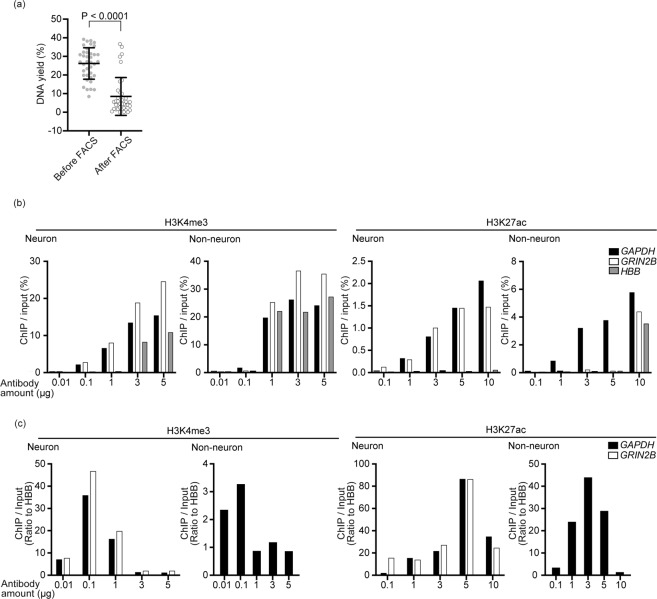
Figure 1.
Optimization of fixation and immunoprecipitation. (a) The relationship between the DNA yield and the duration of crosslinking. The DNA yield was calculated based on the assumption that the amount of genomic DNA in a single human cell was 6.6 pg35. Dark gray dots represent data before FACS, the light gray dots represent data after FACS, and the black bar represent mean ± SD. The statistical significance was determined by t-test. N = 38. (b,c) The relationship between the antibody amount and fold enrichment of the house-keeping gene (GAPDH), a neuronally expressed gene (GRIN2B) and non-neuronally expressed gene (HBB). Fold enrichment was calculated using qPCR of enriched DNA fragment as ChIP/Input (%) (b) or its ratio to HBB (c).

