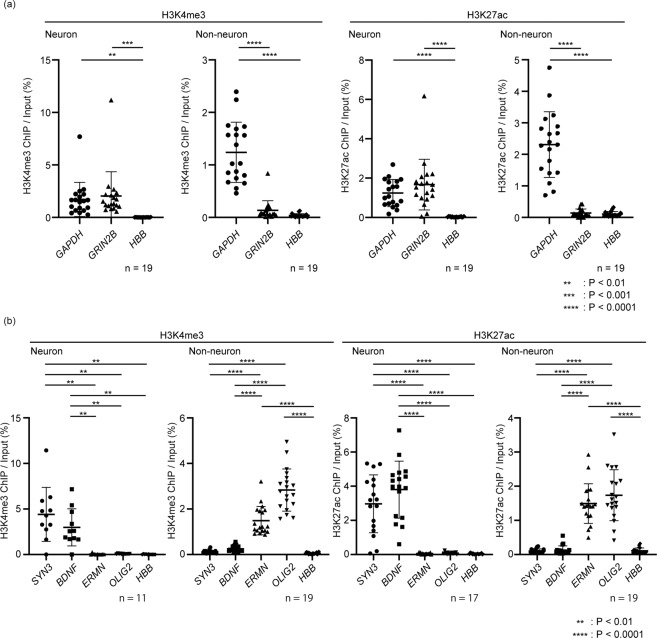
Figure 3.
quantitative PCR of neuronal and non-neuronal ChIP samples. (a) To validate neuronal and non-neuronal specificity of ChIP samples, samples were subjected to qPCR for GAPDH, GRIN2B and HBB which were also used in the optimization step (Fig. 1). (b) qPCR was also performed for SYN3 and BDNF, neuronal regions, and ERMN and OLIG2, non-neuronal regions. Fold enrichment was calculated using qPCR of enriched DNA fragment as ChIP/Input (%). The black bar represents mean ± SD. Statistical significance was determined by one-way ANOVA with post-hoc Turkey (H3K4me3 ChIP using neurons) and Brown-Forsythe ANOVA with post-hoc Dunnett’s correction (the others). The number of samples is shown in each panel. **P < 0.01, ***P < 0.001, ***P < 0.0001.

