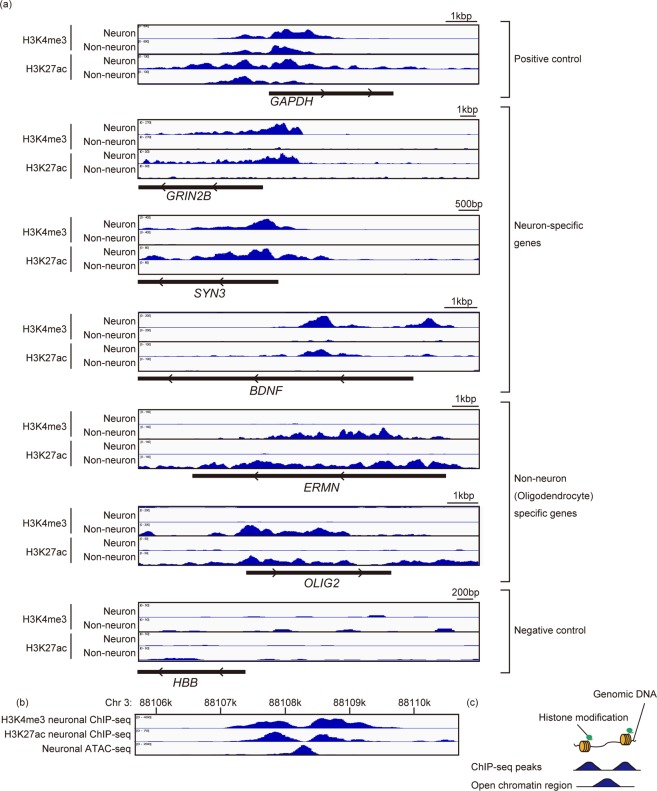
Figure 4.
The distribution of mapped reads. (a) The distribution of mapped reads around TSS of GAPDH, GRIN2B and HBB. ChIP-seq peak of H3K4me3 and H3K27ac in neuronal and non-neuronal cells is displayed on the IGV browser. Black bars under the distribution of the mapped reads show the position and orientation of genes. (b) Representative distribution of ChIP-seq peaks and ATAC-seq peak18. The peaks of H3K4me3 ChIP-seq, H3K27ac ChIP-seq were consistent with ATAC-seq peak. (c) Scheme illustrating the relationship with ChIP-seq peaks and chromatin structure. ChIP-seq peaks represent the genomic region wrapping around the histones with specific modifications, and ATAC-seq peaks represent the genomic region free from protein bindings, thus, ATAC-seq peak generally exist between the ChIP-seq peaks.

