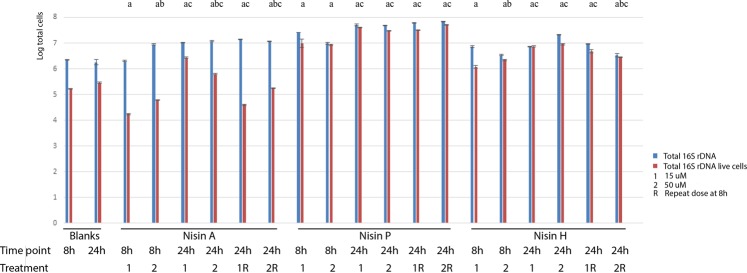
Figure 9.
Total bacteria after nisins A, P and H treatments measured by 16 S rDNA qPCR after faecal fermentation at 8 and 24 h. Two concentrations of peptide were tested, 15 µM and 50 µM. Half of the wells received a second dose of the same concentration at 8 h. Results are the mean of duplicate measurements +/− standard deviation. Statistics was conducted with live cells data: a, indicates significant difference between the treatment and the blank at 8 or 24 h; b, indicates significant difference between 15 µM and 50 µM concentrations; c, indicates significant difference between 8 and 24 h within the same nisin treatment (p < 0.05).

