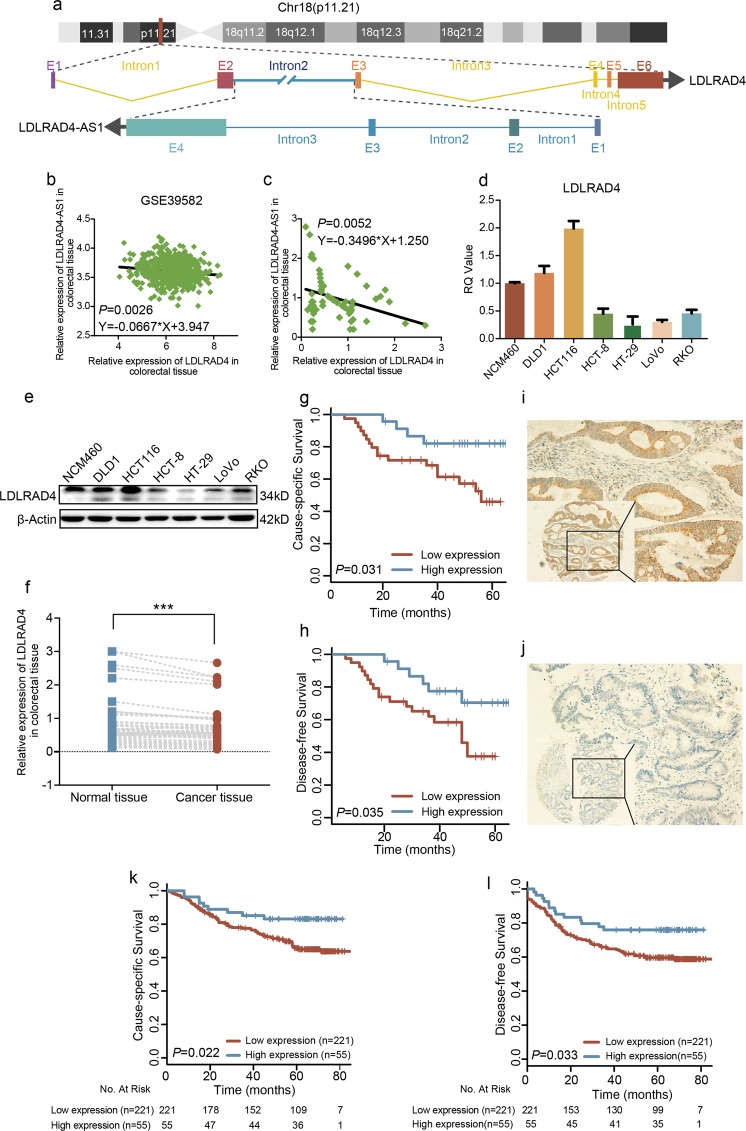
Fig. 3. LncRNA LDLRAD4-AS1 negatively correlated with LDLRAD4.
a lncRNA LDLRAD4-AS1 overlapped with the second intron of LDLRAD4. b lncRNA LDLRAD4-AS1 expression was distinctly negatively correlated with LDLRAD4 based on expression data from GSE39582 (Y = −0.0667*X + 3.947, p = 0.0026). c lncRNA LDLRAD4-AS1 expression was distinctly negatively correlated with LDLRAD4 based on PCR data in the 62 CRC tissues from FUSCC data set (Y = −0.3496*X + 1.250, p = 0.0052). d, e Expression levels of LDLRAD4 in CRC and colon mucosa epithelial (NCM460) cell lines using qRT-PCR analysis (d) and western blotting (e). f Expression levels of LDLRAD4 in 62 paired CRC and adjacent noncancerous tissues. g Kaplan–Meier analysis of cause-specific survival (CSS) in all patients with CRC, according to LDLRAD4 expression using qRT-PCR analysis (log-rank test). h Kaplan–Meier analysis of disease-free survival (DFS) in all patients with CRC, according to LDLRAD4 expression using qRT-PCR analysis (log-rank test). i, j Representative images show high LDLRAD4 expression in CRC tissues (i) compared with low LDLRAD4 expression in CRC tissues (j). k Kaplan–Meier analysis of cause-specific survival (CSS) in all patients with CRC, according to LDLRAD4 expression using IHC analysis (log-rank test). l Kaplan–Meier analysis of disease-free survival (DFS) in all patients with CRC according to LDLRAD4 expression (log-rank test) using IHC analysis. *p < 0.05, **p < 0.01, ***p < 0.001.

