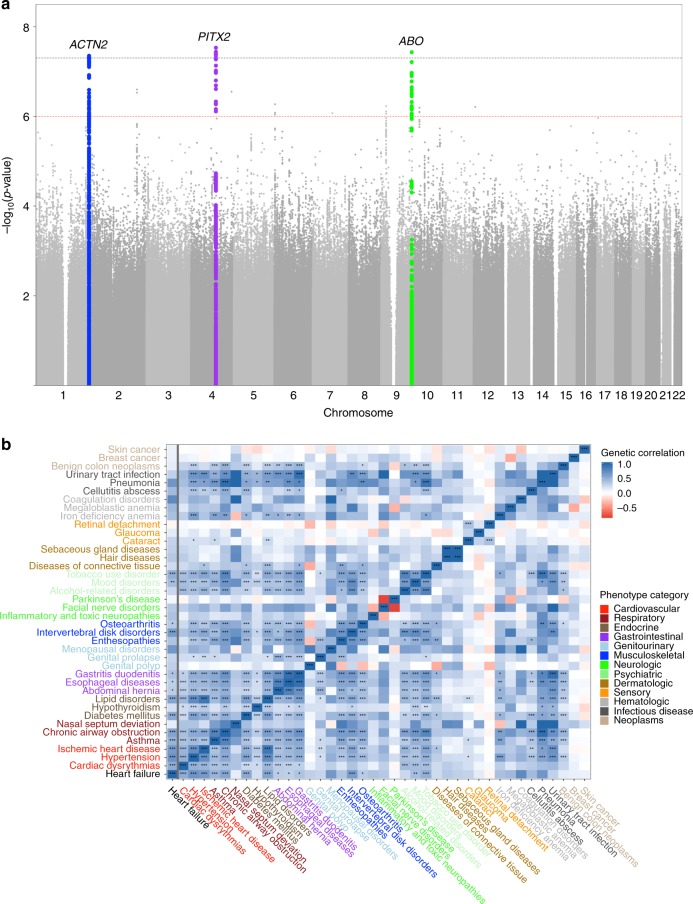
Fig. 1. Summary GWAS and genetic correlation plots.
a Manhattan plot of the GWAS meta-analysis. The black dotted line denotes the genome-wide significance threshold (p-value < 5e-8) while the red dotted line denotes the suggestive threshold (p-value < 1e-6). N = 448,549 independent participants. b Genetic correlation values between heart failure and other complex traits. The x-axis shows the genetic correlation r-value. Traits are color coded based on the group in which they belong. Stars denote the Bonferroni adjusted z-test p-value: (*) 0.001 < p-value < 0.01, (**) 0.0001 < p-value < 0.001, (***) p-value < 0.0001. N = 1,171,562 SNPs. Source data are provided as a Source Data file.

