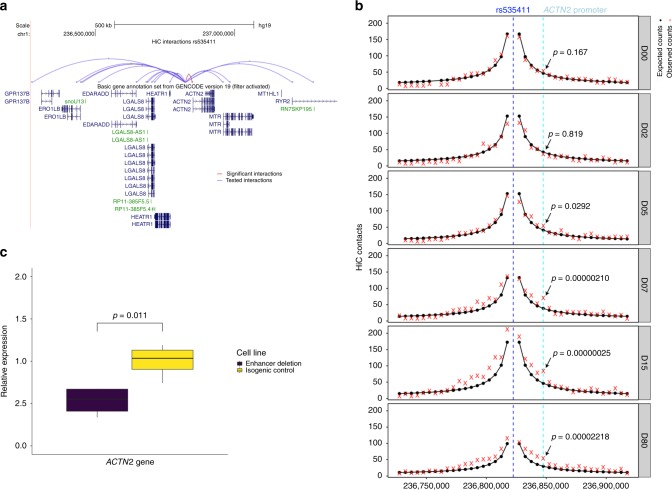
Fig. 4. The fine-mapped regulatory element in chromosome 1 affects ACTN2 gene expression.
a HiC data from cardiomyocytes on Day 80 of differentiation for the interaction between the 5 Kb region containing rs535411 and the promoters of nearby (within 1 Mb) genes. Significant interactions after Bonferroni adjustment are colored red, while non-significant interactions (Bonferroni Poisson test p > 0.05, n = 2 independent biological replicates) are colored blue. b HiC data in different stages of cardiomyocyte differentiation centered at rs535411. Black lines/dots: expected interaction counts, which follow distance-based decay, red crosses: observed interaction counts, Blue dashed line: 5 Kb region containing rs535411, cyan dashed line: 5 Kb region containing ACTN2 promoter, p-value indicates the upper-tailed Poisson probability with the expected counts as lambda. N = 2 independent biological replicates. c Boxplot of relative expression of the ACTN2 gene in cardiomyocytes edited to produce a deletion of the identified putative enhancer element and isogenic controls (n = 4 independent biological replicates). We see that expression of ACTN2 is reduced by 47% in the cardiomyocytes carrying the deletion. Boxplot center line represents the median, the bounds represent the interquartile range (IQR) (25–75%) and the whiskers extend from the bounds to the largest value no further than 1.5*IQR from the bound. Data beyond the end of the whiskers are plotted individually. Source data are provided as a Source Data file.

