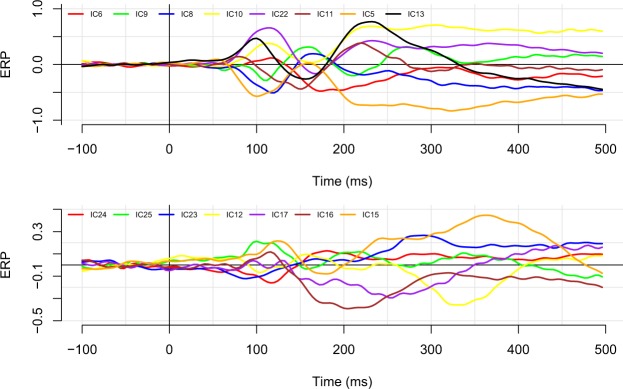
Figure 7.
Average timecourses for components 6, 9, 8, 10, 22, 11, 5, and 13 (top panel), and for components 24, 25, 23, 12, 17, 16, and 15 (bottom panel). Components are ordered on the basis of the their degree of explained variance to enable different scales between the two graphs. Note the large degree of overlap between the various component time courses.

