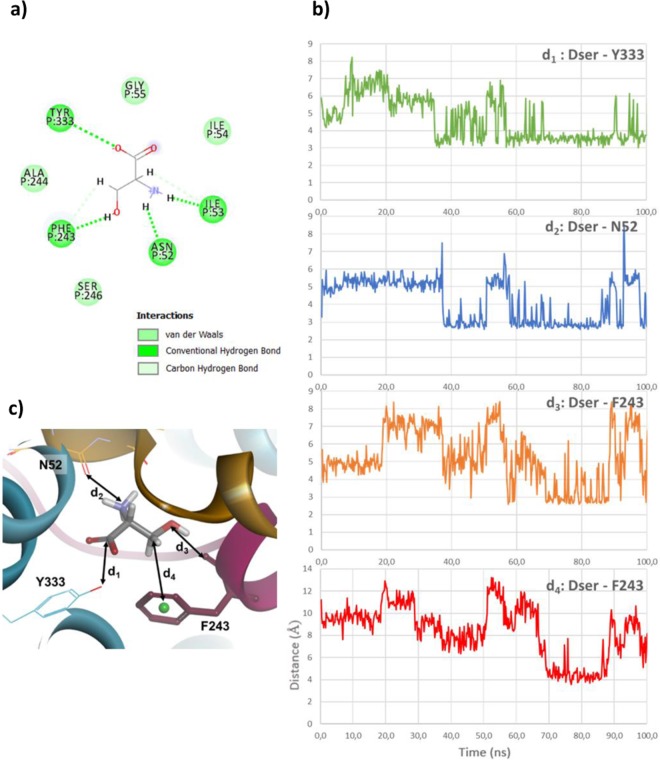
Figure 6.
Asc-1 Interactions observed in the “transition” state. (a) 2D diagram of interactions between d-serine and Asc-1. (b) Monitoring of the distance (Å) between the carbon of d-serine carboxylate group and the oxygen of the Tyr333 hydroxyl group (d1, green), between the d-serine nitrogen and Asn52 main chain oxygen (d2, blue), between d-serine side chain oxygen and Phe243 main chain oxygen (d3, orange), between the carbon of d-serine side chain and centroid of Phe243 phenyl ring (d4, red). (c) Snapshot of MD simulation at 84 ns showing a “transition” state conformation with d1-d4 distances indicated.

